In Single-cell RNAseq analysis, there is a step to find the marker genes for
each cluster. The output from Seurat FindAllMarkers has a column called avg_log2FC.
It is the gene expression log2 fold change between cluster x and all other clusters.
How is that calculated? In this tweet thread by Lior Pachter,
he said that there was a discrepancy for the logFC changes between Seurat and
Scanpy:
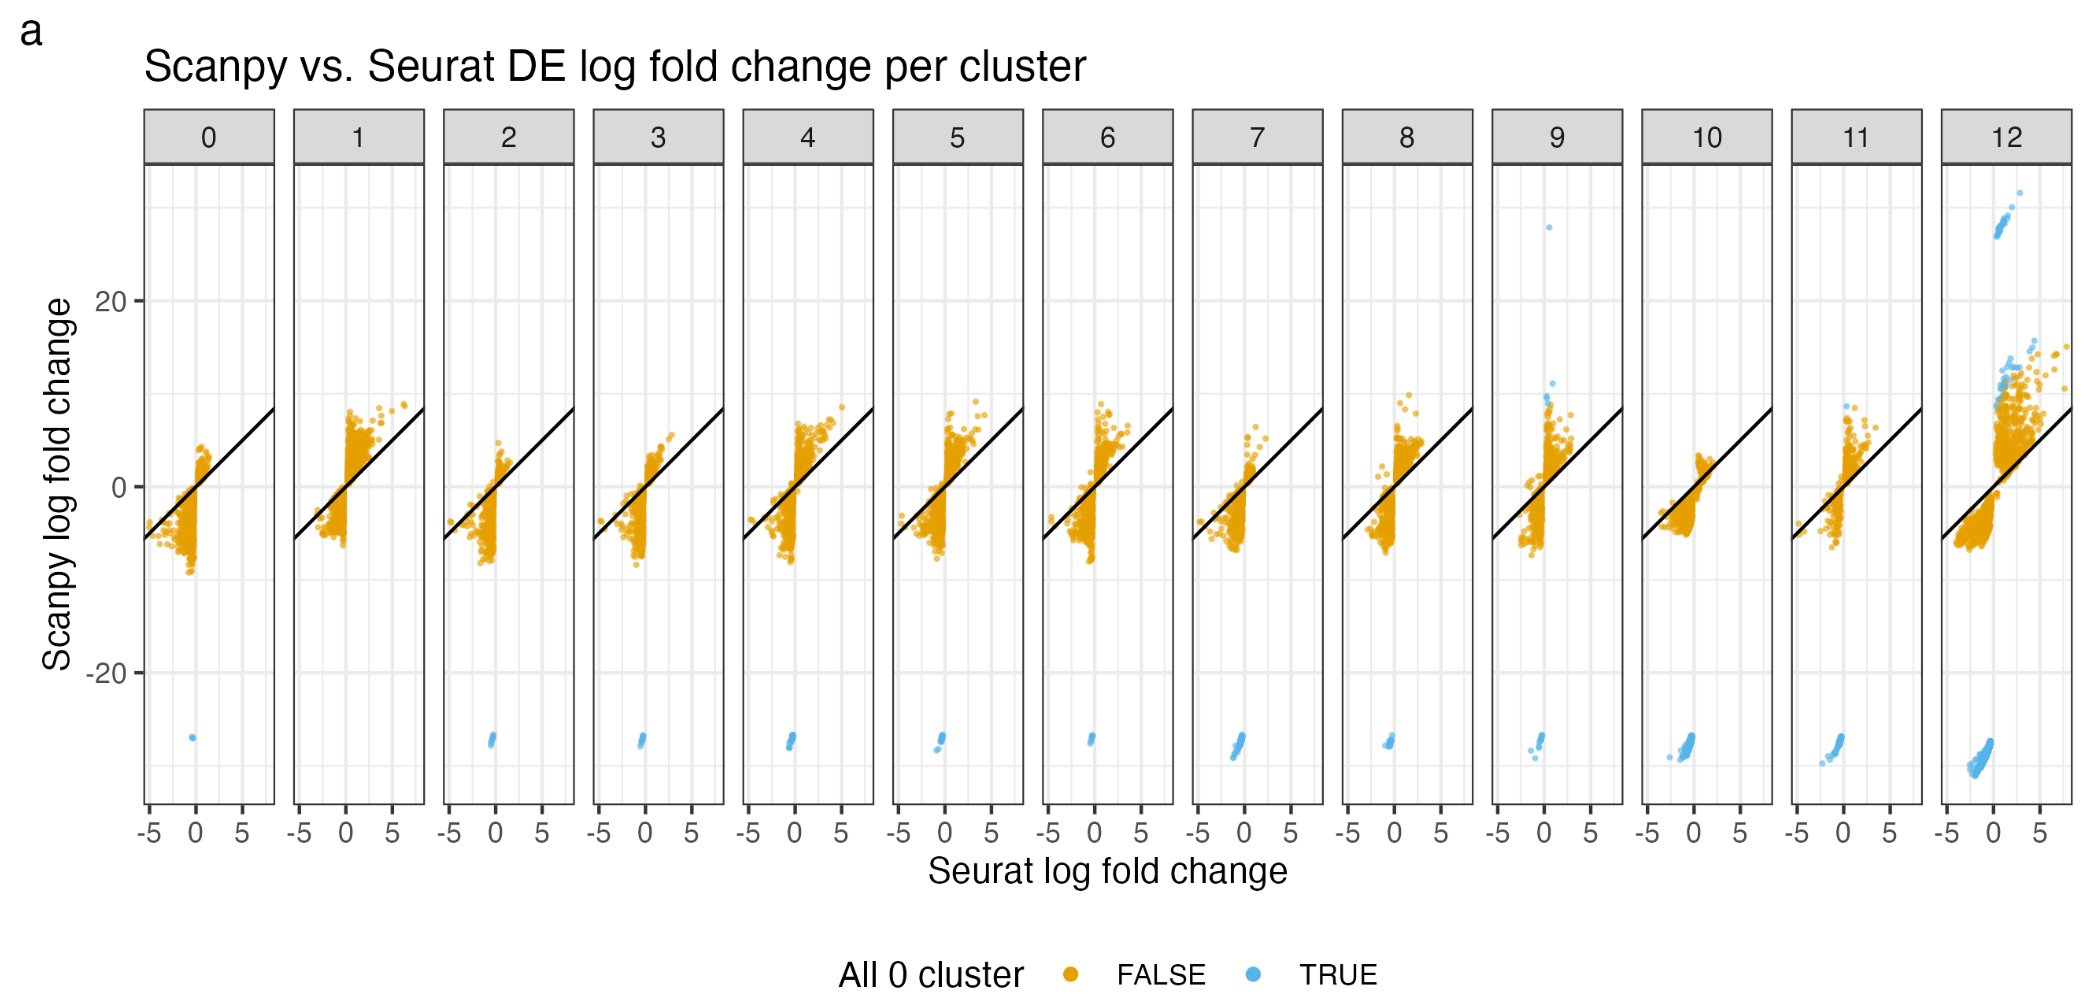
Actually, both Scanpy and Seurat calculate it wrong. Let’s dive in.
library(Seurat)
library(SeuratData)
library(dplyr)
library(scCustomize)

data("pbmc3k")

# some error, need to update the object
pbmc3k<- UpdateSeuratObject(pbmc3k)

pbmc3k
#> An object of class Seurat
#> 13714 features across 2700 samples within 1 assay
#> Active assay: RNA (13714 features, 0 variable features)
#> 2 layers present: counts, dataSome routine processing
pbmc3k<- pbmc3k %>%
  NormalizeData(normalization.method = "LogNormalize", scale.factor = 10000) %>%
  FindVariableFeatures(selection.method = "vst", nfeatures = 2000) %>%
  ScaleData() %>%
  RunPCA(verbose = FALSE) %>%
  FindNeighbors(dims = 1:10, verbose = FALSE) %>%
  FindClusters(resolution = 0.5, verbose = FALSE) %>%
  RunUMAP(dims = 1:10, verbose = FALSE)

pbmc3k<- pbmc3k[, !is.na(pbmc3k$seurat_annotations)]

p1<- DimPlot_scCustom(pbmc3k, reduction = "umap", label = TRUE, group.by =
                        "RNA_snn_res.0.5")

p2<- DimPlot_scCustom(pbmc3k, reduction = "umap", label = TRUE, group.by = "seurat_annotations", label.size = 3)

p1 + p2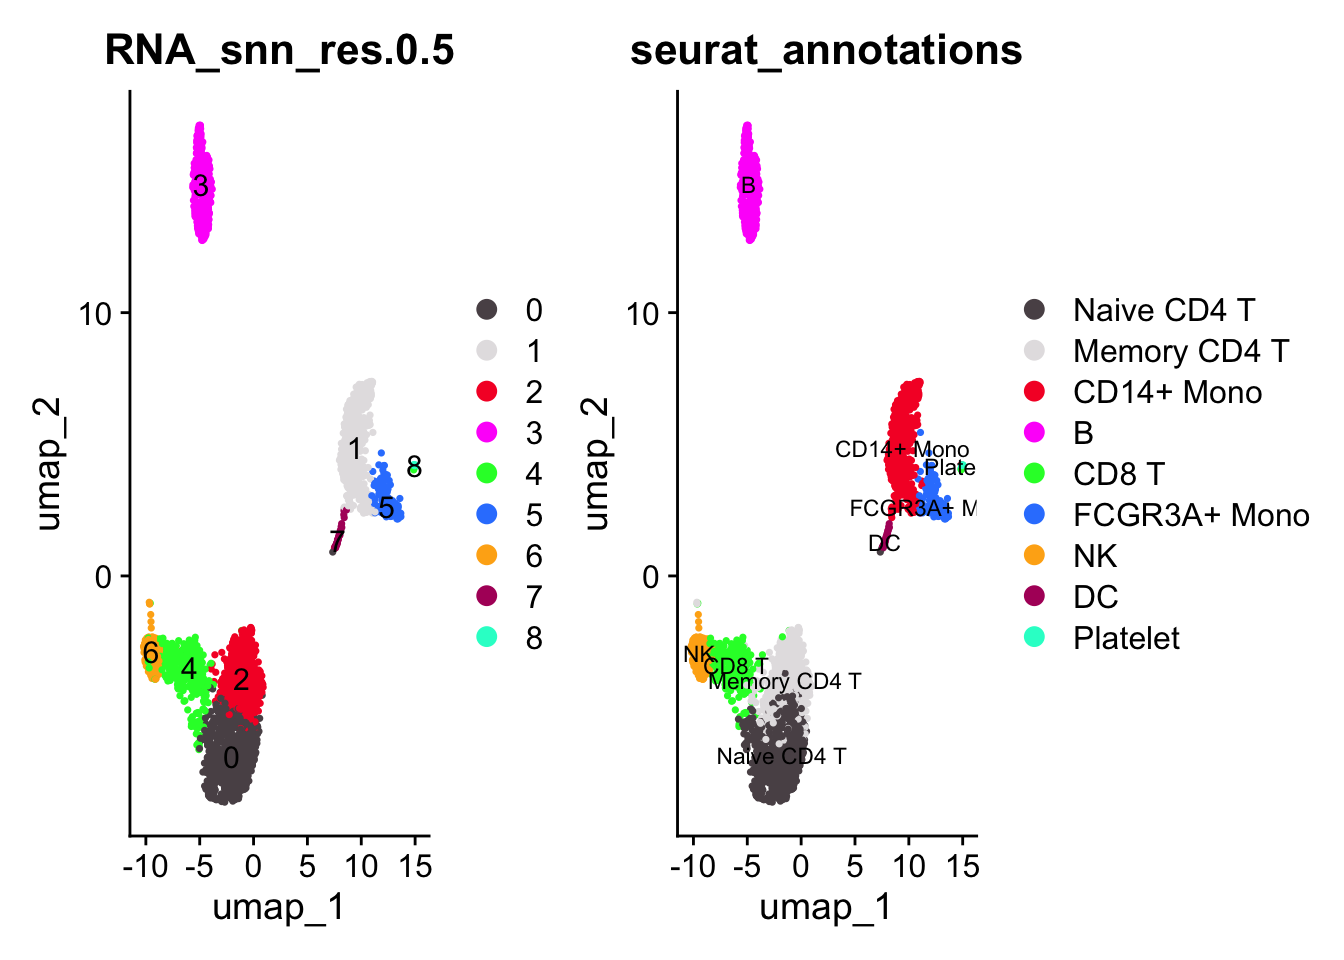
# use Seurat's FindAllMarkers function
markers_seurat<- FindAllMarkers(pbmc3k)

head(markers_seurat)
#> p_val avg_log2FC pct.1 pct.2 p_val_adj cluster gene
#> RPS6 5.467436e-142 0.6963639 1.000 0.995 7.498042e-138 0 RPS6
#> RPS12 1.026837e-138 0.7323892 1.000 0.991 1.408204e-134 0 RPS12
#> RPS27 9.369933e-132 0.7125597 0.999 0.992 1.284993e-127 0 RPS27
#> RPL32 1.289946e-131 0.6221148 0.999 0.995 1.769031e-127 0 RPL32
#> RPS14 9.504872e-124 0.6261648 1.000 0.994 1.303498e-119 0 RPS14
#> CYBA 1.875899e-123 -1.7566153 0.658 0.913 2.572608e-119 0 CYBALet’s take a look at CD19 which is a B cell marker. cluster 3 is the B cell cluster.
markers_seurat %>%
        filter(cluster == 3) %>%
        filter(gene == "CD19")
#> p_val avg_log2FC pct.1 pct.2 p_val_adj cluster gene
#> CD19.3 3.322761e-87 5.62015 0.216 0.007 4.556834e-83 3 CD19By default, FindAllMarkers uses Wilcoxon Rank Sum test. use ?FindAllMarkers
to see the details of other tests.
Three things to note.
the p-values are very small. When you have hundreds or thousands of cells per cluster, the p-values will be very small. The p-value in statistical tests, including the Wilcoxon rank-sum test (also known as the Mann-Whitney U test), is influenced by both the sample size and the variability. As the sample size increases, the p-value tends to decrease, assuming there is a non-zero effect size.
The p-values are inflated, as we cluster the cells first then use the cluster label to calculate the p-values. We are double-dipping the data. See this twitter thread for more details, and this paper Valid post-clustering differential analysis for single-cell RNA-Seq
There are nuances in how the log2 Fold change is calculated.
ScanpyandSeurathave different implementations.
Seurat formula:
\(R_{g}=\log_{2}(\frac{1}{n_{1}}\sum_{i\in G_{1}}(exp(Y_{ig})-1)+1)-log_{2}(\frac{1}{n_{2}}\sum_{i\in G_{2}}(exp(Y_{ig})-1)+1),\)
Scanpy formula:
\(P_{g}=\log_{2}(exp(\frac{1}{n_{1}}\sum_{i\in G_{1}}Y_{ig})-1+\epsilon)-log_{2}(exp(\frac{1}{n_{2}}\sum_{i\in G_{2}}Y_{ig})-1+\epsilon),\)
where \(\epsilon=10^{-9}\).
where \(Y_{ig}\) are the log-transformed expression values for cell \(i\) and gene \(g\), \(G_{1}\) and \(G_{2}\) are the indices for two groups of cells, and \(n_{1}\) and \(n_{2}\) are the numbers of cells in the respective groups.
Let’s calculate the fold change manually
NormalizeData(normalization.method = "LogNormalize", scale.factor = 10000) this
step divide the raw gene counts with the total counts of that cell (library size)
and then natural log it and times the scaling factor of 10000.
# CD19 natural log library size normalized expression
log_normalized_data<- pbmc3k@assays$RNA@data["CD19", ]

# a logical vector indicating the cells from cluster 3
cluster_B_index<- pbmc3k$seurat_clusters == 3

# negate it to get the cells from all other clusters
other_clusters_index<- !cluster_B_index

# the natural log normalized counts for gene x from cluster 0
cluster_B_norm_data<- log_normalized_data[cluster_B_index]

# the natural log normalized counts for gene x from all other clusters
other_cluster_norm_data<- log_normalized_data[other_clusters_index]
Now, let’s exp it back and minus 1 to get the lib normalized counts without
log transformation; take the mean across cells plus a tiny number, then log2
transform:
# cells from B cell cluster
log2_mean_clusterB<- log2(mean(exp(cluster_B_norm_data)-1) + 10^-9)

log2_mean_clusterB
#> [1] 0.5181239# cells from all other clusters
log2_mean_other_cluster<- log2(mean(exp(other_cluster_norm_data)-1) +10^-9)
log2_mean_other_cluster#> [1] -5.1208Now, let’s calculate the log2 fold change:
log2_mean_clusterB - log2_mean_other_cluster#> [1] 5.638924So, it seems Seurat updated their calculation method to add a small value
of 10^-9 rather than 1. This is almost the same as the FindAllMarkers results…
percentage of cells that are positive of CD19 in B cells and other cells:
pct.in<- mean(cluster_B_norm_data != 0)
pct.in
#> [1] 0.2157434pct.out<- mean(other_cluster_norm_data !=0)
pct.out#> [1] 0.007407407The percentages are exactly the same as the FindAllMarkers output
If we use the the old formula which add 1 rather than a small value 1e^-9:
log2(mean(exp(cluster_B_norm_data)-1) + 1) -
        log2(mean(exp(other_cluster_norm_data)-1) + 1)
#> [1] 1.241319The logFC is very different. The pseudo-count can have a large effect when the counts are small.
If we calculate the Scanpy way
# the natural log normalized counts for gene x from cluster 0
cluster_B_norm_data<- log_normalized_data[cluster_B_index]

# the natural log normalized counts for gene x from all other clusters
other_cluster_norm_data<- log_normalized_data[other_clusters_index]
calculate the mean of the natural log normalized counts and then exp it back
log2(exp(mean(cluster_B_norm_data)) -1 + 10^-9) -
        log2(exp(mean(other_cluster_norm_data)) -1 + 10^-9)
#> [1] 5.508951The Scanpy version take the mean of the natural log noramlized the counts first,
then exp back, minus 1, add a small number, then log2 transform. It does not
seems correct either
However, the value is close to the updated Seurat version.
Let’s do it for all genes in the B cell cluster
seurat_log2FC<- function(method="old"){
        # natural log library size normalized expression
        log_normalized_data<- pbmc3k@assays$RNA@data

        # a logical vector indicating the cells from cluster 0
        cluster_B_index<- pbmc3k$seurat_clusters == 3

        # negate it to get the cells from all other clusters
        other_clusters_index<- !cluster_B_index

        # the natural log normalized counts for gene x from cluster 3
        cluster_B_norm_data<- log_normalized_data[, cluster_B_index]

        # the natural log normalized counts for gene x from all other clusters
        other_cluster_norm_data<- log_normalized_data[,other_clusters_index]

        if (method == "new"){
               x<-  apply(cluster_B_norm_data, MARGIN =1,
                          function(x) log2(mean(exp(x)-1) + 10^-9))
               y<-  apply(other_cluster_norm_data, MARGIN =1,
                          function(x) log2(mean(exp(x)-1) +10^-9))
               return(x-y)

        } else if (method == "old"){
               x<-  apply(cluster_B_norm_data, MARGIN =1,
                          function(x) log2(mean(exp(x)-1) + 1))
               y<-  apply(other_cluster_norm_data, MARGIN =1,
                          function(x) log2(mean(exp(x)-1) + 1))
               return(x-y)
        }
}

scanpy_log2FC<- function(){
        # natural log library size normalized expression
        log_normalized_data<- pbmc3k@assays$RNA@data

        # a logical vector indicating the cells from cluster 0
        cluster_B_index<- pbmc3k$seurat_clusters == 3

        # negate it to get the cells from all other clusters
        other_clusters_index<- !cluster_B_index

        # the natural log normalized counts for gene x from cluster 3
        cluster_B_norm_data<- log_normalized_data[, cluster_B_index]

        # the natural log normalized counts for gene x from all other clusters
        other_cluster_norm_data<- log_normalized_data[,other_clusters_index]

        x<-  apply(cluster_B_norm_data, MARGIN =1,
                          function(x) log2(exp(mean(x)) -1 + 10^-9))

        y<-  apply(other_cluster_norm_data, MARGIN =1,
                          function(x) log2(exp(mean(x)) -1 + 10^-9))
        return(x-y)
}
Calculate the Fold changes using the functions for all genes comparing cluster 3 versus all other clusters:
seurat_old_fold<- seurat_log2FC(method = "old")

seurat_new_fold<- seurat_log2FC(method = "new")

scanpy_fold<- scanpy_log2FC()
put them into a single dataframe
seurat_old_df<- tibble::enframe(seurat_old_fold, name = "gene", value = "seurat_old")
seurat_new_df<- tibble::enframe(seurat_new_fold, name = "gene", value = "seurat_new")
scanpy_df<- tibble::enframe(scanpy_fold, name = "gene", value = "scanpy")
plotting
library(ggplot2)
fold_df<- purrr::reduce(list(seurat_old_df, seurat_new_df, scanpy_df ), inner_join)

p1<- ggplot(fold_df) +
        geom_point(aes(x=seurat_old, y = scanpy), size = 0.3, alpha = 0.5)+
        geom_abline(intercept = 0, slope = 1, linetype = 2, color = "red") +
        coord_equal()


p2<- ggplot(fold_df) +
        geom_point(aes(x=seurat_new, y = scanpy), size = 0.3, alpha = 0.5) +
        geom_abline(intercept = 0, slope = 1, linetype = 2, color = "red") +
        coord_equal() +
        theme_bw(base_size = 14)

p1 + p2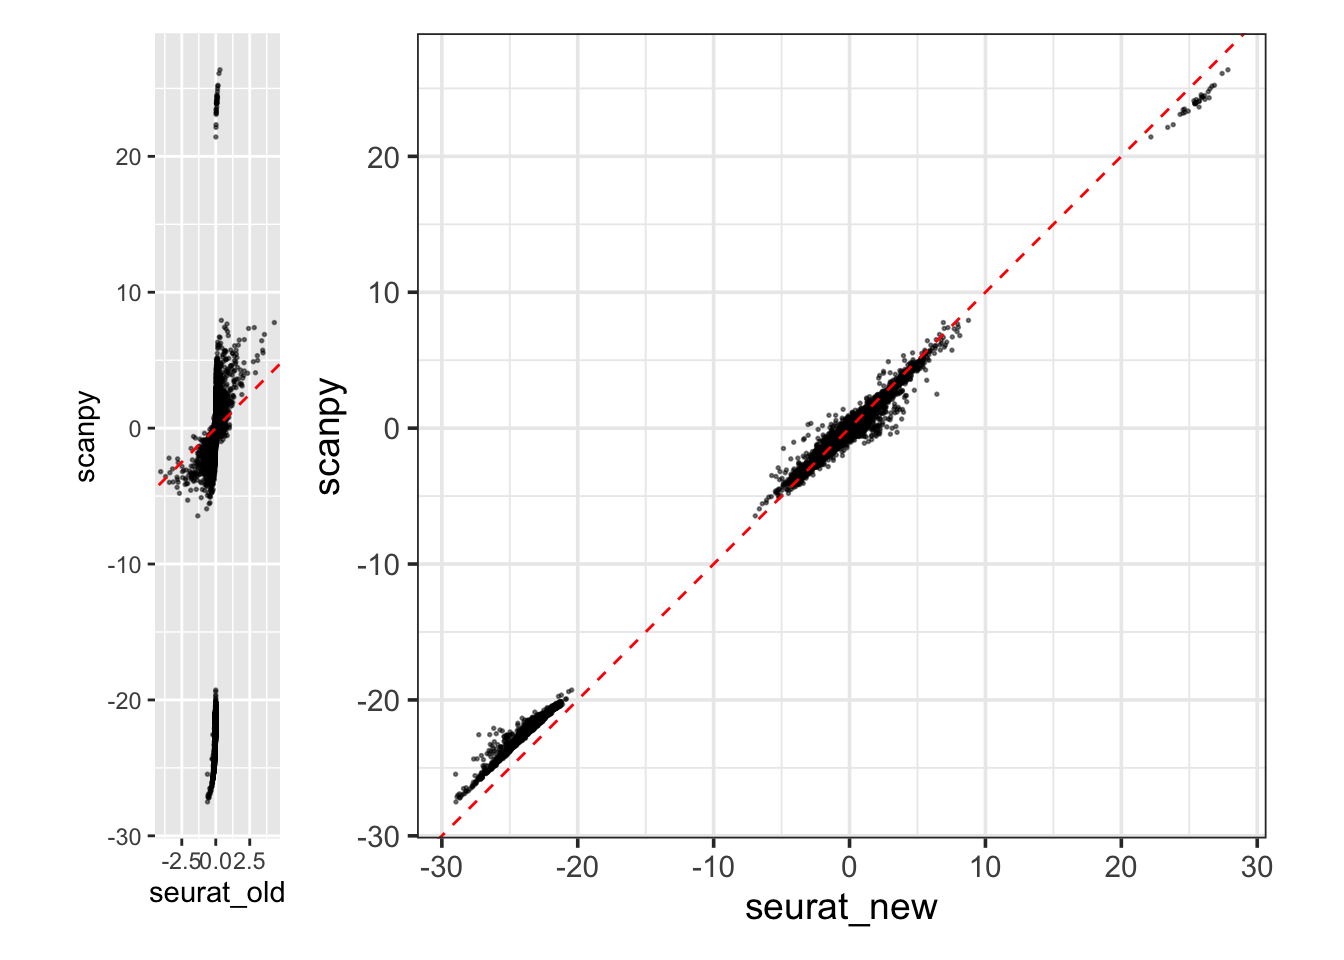
The figure on the left recapitulates the discrepancy showed in the figure in the
beginning of the post. The updated calculation in Seurat on the right is now
very similar to scanpy's calculation.
The updated Seurat formula:
\(R_{g}=\log_{2}(\frac{1}{n_{1}}\sum_{i\in G_{1}}(exp(Y_{ig})-1)+\epsilon)-log_{2}(\frac{1}{n_{2}}\sum_{i\in G_{2}}(exp(Y_{ig})-1)+\epsilon),\)
where \(\epsilon=10^{-9}\).
Conclusions
Details matters. Do not blindly trust packages even they are established ones.
Small differences in treating the pseudo-counts can have big differences.
Single-cell is a field developing so fast that we do not have consensus on many things. The
Rworld is split intoSeuratandBioconductorand thepythonworld is dominated by thescverse. We should encourage interactions between different communities to solve common challenges.
Further reading
Markers different in BPCells than in Seurat
devtools::session_info()#> ─ Session info 😃 🖍️ 🏒 ──────────────────────────────────────────────────
#> hash: grinning face with big eyes, crayon, ice hockey
#>
#> setting value
#> version R version 4.1.2 (2021-11-01)
#> os macOS Big Sur 10.16
#> system x86_64, darwin17.0
#> ui X11
#> language (EN)
#> collate en_US.UTF-8
#> ctype en_US.UTF-8
#> tz America/New_York
#> date 2024-03-07
#> pandoc 3.1.1 @ /Applications/RStudio.app/Contents/Resources/app/quarto/bin/tools/ (via rmarkdown)
#>
#> ─ Packages ───────────────────────────────────────────────────────────────────
#> package * version date (UTC) lib source
#> abind 1.4-5 2016-07-21 [1] CRAN (R 4.1.0)
#> beeswarm 0.4.0 2021-06-01 [1] CRAN (R 4.1.0)
#> blogdown 1.7 2021-12-19 [1] CRAN (R 4.1.2)
#> bookdown 0.24 2021-09-02 [1] CRAN (R 4.1.0)
#> bslib 0.3.1 2021-10-06 [1] CRAN (R 4.1.0)
#> cachem 1.0.6 2021-08-19 [1] CRAN (R 4.1.0)
#> callr 3.7.0 2021-04-20 [1] CRAN (R 4.1.0)
#> circlize 0.4.13 2021-06-09 [1] CRAN (R 4.1.0)
#> cli 3.6.1 2023-03-23 [1] CRAN (R 4.1.2)
#> cluster 2.1.2 2021-04-17 [1] CRAN (R 4.1.2)
#> codetools 0.2-18 2020-11-04 [1] CRAN (R 4.1.2)
#> colorspace 2.0-2 2021-06-24 [1] CRAN (R 4.1.0)
#> cowplot 1.1.1 2020-12-30 [1] CRAN (R 4.1.0)
#> crayon 1.4.2 2021-10-29 [1] CRAN (R 4.1.0)
#> data.table 1.14.2 2021-09-27 [1] CRAN (R 4.1.0)
#> DBI 1.1.1 2021-01-15 [1] CRAN (R 4.1.0)
#> deldir 1.0-6 2021-10-23 [1] CRAN (R 4.1.0)
#> desc 1.4.0 2021-09-28 [1] CRAN (R 4.1.0)
#> devtools 2.4.2 2021-06-07 [1] CRAN (R 4.1.0)
#> digest 0.6.28 2021-09-23 [1] CRAN (R 4.1.0)
#> dotCall64 1.1-1 2023-11-28 [1] CRAN (R 4.1.2)
#> dplyr * 1.1.2 2023-04-20 [1] CRAN (R 4.1.2)
#> ellipsis 0.3.2 2021-04-29 [1] CRAN (R 4.1.0)
#> evaluate 0.14 2019-05-28 [1] CRAN (R 4.1.0)
#> fansi 0.5.0 2021-05-25 [1] CRAN (R 4.1.0)
#> farver 2.1.0 2021-02-28 [1] CRAN (R 4.1.0)
#> fastDummies 1.7.3 2023-07-06 [1] CRAN (R 4.1.2)
#> fastmap 1.1.0 2021-01-25 [1] CRAN (R 4.1.0)
#> fitdistrplus 1.1-6 2021-09-28 [1] CRAN (R 4.1.0)
#> forcats 0.5.1 2021-01-27 [1] CRAN (R 4.1.0)
#> fs 1.5.0 2020-07-31 [1] CRAN (R 4.1.0)
#> future 1.25.0 2022-04-24 [1] CRAN (R 4.1.2)
#> future.apply 1.8.1 2021-08-10 [1] CRAN (R 4.1.0)
#> generics 0.1.3 2022-07-05 [1] CRAN (R 4.1.2)
#> ggbeeswarm 0.6.0 2017-08-07 [1] CRAN (R 4.1.0)
#> ggplot2 * 3.4.4 2023-10-12 [1] CRAN (R 4.1.2)
#> ggprism 1.0.3.9000 2021-12-07 [1] Github (csdaw/ggprism@e21c3ee)
#> ggrastr 1.0.1 2021-12-08 [1] CRAN (R 4.1.0)
#> ggrepel 0.9.3 2023-02-03 [1] CRAN (R 4.1.2)
#> ggridges 0.5.4 2022-09-26 [1] CRAN (R 4.1.2)
#> GlobalOptions 0.1.2 2020-06-10 [1] CRAN (R 4.1.0)
#> globals 0.14.0 2020-11-22 [1] CRAN (R 4.1.0)
#> glue 1.6.2 2022-02-24 [1] CRAN (R 4.1.2)
#> goftest 1.2-3 2021-10-07 [1] CRAN (R 4.1.0)
#> gridExtra 2.3 2017-09-09 [1] CRAN (R 4.1.0)
#> gtable 0.3.0 2019-03-25 [1] CRAN (R 4.1.0)
#> highr 0.9 2021-04-16 [1] CRAN (R 4.1.0)
#> htmltools 0.5.2 2021-08-25 [1] CRAN (R 4.1.0)
#> htmlwidgets 1.5.4 2021-09-08 [1] CRAN (R 4.1.0)
#> httpuv 1.6.3 2021-09-09 [1] CRAN (R 4.1.0)
#> httr 1.4.2 2020-07-20 [1] CRAN (R 4.1.0)
#> ica 1.0-2 2018-05-24 [1] CRAN (R 4.1.0)
#> ifnb.SeuratData * 3.1.0 2024-01-17 [1] local
#> igraph 1.2.7 2021-10-15 [1] CRAN (R 4.1.0)
#> irlba 2.3.5.1 2022-10-03 [1] CRAN (R 4.1.2)
#> janitor 2.1.0 2021-01-05 [1] CRAN (R 4.1.0)
#> jquerylib 0.1.4 2021-04-26 [1] CRAN (R 4.1.0)
#> jsonlite 1.7.2 2020-12-09 [1] CRAN (R 4.1.0)
#> KernSmooth 2.23-20 2021-05-03 [1] CRAN (R 4.1.2)
#> knitr 1.36 2021-09-29 [1] CRAN (R 4.1.0)
#> labeling 0.4.2 2020-10-20 [1] CRAN (R 4.1.0)
#> later 1.3.0 2021-08-18 [1] CRAN (R 4.1.0)
#> lattice 0.20-45 2021-09-22 [1] CRAN (R 4.1.2)
#> lazyeval 0.2.2 2019-03-15 [1] CRAN (R 4.1.0)
#> leiden 0.3.9 2021-07-27 [1] CRAN (R 4.1.0)
#> lifecycle 1.0.3 2022-10-07 [1] CRAN (R 4.1.2)
#> limma 3.50.0 2021-10-26 [1] Bioconductor
#> listenv 0.8.0 2019-12-05 [1] CRAN (R 4.1.0)
#> lmtest 0.9-39 2021-11-07 [1] CRAN (R 4.1.0)
#> lubridate 1.8.0 2021-10-07 [1] CRAN (R 4.1.0)
#> magrittr 2.0.1 2020-11-17 [1] CRAN (R 4.1.0)
#> MASS 7.3-54 2021-05-03 [1] CRAN (R 4.1.2)
#> Matrix 1.6-3 2023-11-14 [1] CRAN (R 4.1.2)
#> matrixStats 0.61.0 2021-09-17 [1] CRAN (R 4.1.0)
#> memoise 2.0.0 2021-01-26 [1] CRAN (R 4.1.0)
#> mime 0.12 2021-09-28 [1] CRAN (R 4.1.0)
#> miniUI 0.1.1.1 2018-05-18 [1] CRAN (R 4.1.0)
#> munsell 0.5.0 2018-06-12 [1] CRAN (R 4.1.0)
#> nlme 3.1-153 2021-09-07 [1] CRAN (R 4.1.2)
#> paletteer 1.4.0 2021-07-20 [1] CRAN (R 4.1.0)
#> parallelly 1.31.1 2022-04-22 [1] CRAN (R 4.1.2)
#> patchwork 1.1.1 2020-12-17 [1] CRAN (R 4.1.0)
#> pbapply 1.5-0 2021-09-16 [1] CRAN (R 4.1.0)
#> pbmc3k.SeuratData * 3.1.4 2022-08-03 [1] local
#> pbmcref.SeuratData * 1.0.0 2023-09-14 [1] local
#> pillar 1.9.0 2023-03-22 [1] CRAN (R 4.1.2)
#> pkgbuild 1.2.0 2020-12-15 [1] CRAN (R 4.1.0)
#> pkgconfig 2.0.3 2019-09-22 [1] CRAN (R 4.1.0)
#> pkgload 1.2.3 2021-10-13 [1] CRAN (R 4.1.0)
#> plotly 4.10.0 2021-10-09 [1] CRAN (R 4.1.0)
#> plyr 1.8.6 2020-03-03 [1] CRAN (R 4.1.0)
#> png 0.1-8 2022-11-29 [1] CRAN (R 4.1.2)
#> polyclip 1.10-0 2019-03-14 [1] CRAN (R 4.1.0)
#> presto 1.0.0 2023-03-30 [1] Github (immunogenomics/presto@045390a)
#> prettyunits 1.1.1 2020-01-24 [1] CRAN (R 4.1.0)
#> prismatic 1.1.0 2021-10-17 [1] CRAN (R 4.1.0)
#> processx 3.5.2 2021-04-30 [1] CRAN (R 4.1.0)
#> progressr 0.9.0 2021-09-24 [1] CRAN (R 4.1.0)
#> promises 1.2.0.1 2021-02-11 [1] CRAN (R 4.1.0)
#> ps 1.6.0 2021-02-28 [1] CRAN (R 4.1.0)
#> purrr 1.0.1 2023-01-10 [1] CRAN (R 4.1.2)
#> R6 2.5.1 2021-08-19 [1] CRAN (R 4.1.0)
#> RANN 2.6.1 2019-01-08 [1] CRAN (R 4.1.0)
#> rappdirs 0.3.3 2021-01-31 [1] CRAN (R 4.1.0)
#> RColorBrewer 1.1-2 2014-12-07 [1] CRAN (R 4.1.0)
#> Rcpp 1.0.11 2023-07-06 [1] CRAN (R 4.1.2)
#> RcppAnnoy 0.0.19 2021-07-30 [1] CRAN (R 4.1.0)
#> RcppHNSW 0.3.0 2020-09-06 [1] CRAN (R 4.1.0)
#> rematch2 2.1.2 2020-05-01 [1] CRAN (R 4.1.0)
#> remotes 2.4.1 2021-09-29 [1] CRAN (R 4.1.0)
#> reshape2 1.4.4 2020-04-09 [1] CRAN (R 4.1.0)
#> reticulate 1.28 2023-01-27 [1] CRAN (R 4.1.2)
#> rlang 1.1.3 2024-01-10 [1] CRAN (R 4.1.2)
#> rmarkdown 2.11 2021-09-14 [1] CRAN (R 4.1.0)
#> ROCR 1.0-11 2020-05-02 [1] CRAN (R 4.1.0)
#> rprojroot 2.0.2 2020-11-15 [1] CRAN (R 4.1.0)
#> RSpectra 0.16-0 2019-12-01 [1] CRAN (R 4.1.0)
#> rstudioapi 0.13 2020-11-12 [1] CRAN (R 4.1.0)
#> Rtsne 0.15 2018-11-10 [1] CRAN (R 4.1.0)
#> sass 0.4.0 2021-05-12 [1] CRAN (R 4.1.0)
#> scales 1.3.0 2023-11-28 [1] CRAN (R 4.1.2)
#> scattermore 1.2 2023-06-12 [1] CRAN (R 4.1.2)
#> scCustomize * 2.1.2 2024-02-28 [1] CRAN (R 4.1.2)
#> sctransform 0.4.1 2023-10-19 [1] CRAN (R 4.1.2)
#> sessioninfo 1.2.1 2021-11-02 [1] CRAN (R 4.1.0)
#> Seurat * 5.0.1 2023-11-17 [1] CRAN (R 4.1.2)
#> SeuratData * 0.2.2 2022-08-03 [1] Github (satijalab/seurat-data@d6a8ce6)
#> SeuratObject * 5.0.1 2023-11-17 [1] CRAN (R 4.1.2)
#> shape 1.4.6 2021-05-19 [1] CRAN (R 4.1.0)
#> shiny 1.7.1 2021-10-02 [1] CRAN (R 4.1.0)
#> snakecase 0.11.0 2019-05-25 [1] CRAN (R 4.1.0)
#> sp * 1.6-0 2023-01-19 [1] CRAN (R 4.1.2)
#> spam 2.10-0 2023-10-23 [1] CRAN (R 4.1.2)
#> spatstat.data 3.0-0 2022-10-21 [1] CRAN (R 4.1.2)
#> spatstat.explore 3.0-6 2023-01-26 [1] CRAN (R 4.1.2)
#> spatstat.geom 3.0-6 2023-01-30 [1] CRAN (R 4.1.2)
#> spatstat.random 3.1-3 2023-01-25 [1] CRAN (R 4.1.2)
#> spatstat.sparse 3.0-0 2022-10-21 [1] CRAN (R 4.1.2)
#> spatstat.utils 3.0-1 2022-10-19 [1] CRAN (R 4.1.2)
#> stringi 1.7.5 2021-10-04 [1] CRAN (R 4.1.0)
#> stringr 1.5.1 2023-11-14 [1] CRAN (R 4.1.2)
#> survival 3.2-13 2021-08-24 [1] CRAN (R 4.1.2)
#> tensor 1.5 2012-05-05 [1] CRAN (R 4.1.0)
#> testthat 3.1.0 2021-10-04 [1] CRAN (R 4.1.0)
#> tibble 3.2.1 2023-03-20 [1] CRAN (R 4.1.2)
#> tidyr 1.3.0 2023-01-24 [1] CRAN (R 4.1.2)
#> tidyselect 1.2.0 2022-10-10 [1] CRAN (R 4.1.2)
#> usethis 2.1.3 2021-10-27 [1] CRAN (R 4.1.0)
#> utf8 1.2.2 2021-07-24 [1] CRAN (R 4.1.0)
#> uwot 0.1.14 2022-08-22 [1] CRAN (R 4.1.2)
#> vctrs 0.6.2 2023-04-19 [1] CRAN (R 4.1.2)
#> vipor 0.4.5 2017-03-22 [1] CRAN (R 4.1.0)
#> viridisLite 0.4.0 2021-04-13 [1] CRAN (R 4.1.0)
#> withr 2.5.0 2022-03-03 [1] CRAN (R 4.1.2)
#> xfun 0.36 2022-12-21 [1] CRAN (R 4.1.2)
#> xtable 1.8-4 2019-04-21 [1] CRAN (R 4.1.0)
#> yaml 2.2.1 2020-02-01 [1] CRAN (R 4.1.0)
#> zoo 1.8-9 2021-03-09 [1] CRAN (R 4.1.0)
#>
#> [1] /Library/Frameworks/R.framework/Versions/4.1/Resources/library
#>
#> ──────────────────────────────────────────────────────────────────────────────