Download the data
https://www.ncbi.nlm.nih.gov/geo/query/acc.cgi?acc=GSE116256
cd data/GSE116256
wget https://ftp.ncbi.nlm.nih.gov/geo/series/GSE116nnn/GSE116256/suppl/GSE116256_RAW.tar
tar xvf GSE116256_RAW.tar
rm  GSE116256_RAW.tar
Depending on how the authors upload their data.
Some authors may just upload the merged count matrix file. This is the easiest situation.
In this dataset, each sample has a separate set of matrix (*dem.txt.gz), features and barcodes.
Total, there are 43 samples. For each sample, it has an associated metadata file (*anno.txt.gz) too.
 You can inspect the files in command line:
zless -S GSM3587923_AML1012-D0.dem.txt.gzGo back to R.
Load the libraries:
library(here)
library(stringr)
library(dplyr)
library(ggplot2)
library(Seurat)
library(purrr)
library(readr)
library(harmony)
library(scCustomize)
library(SeuratDisk)
read in the count matrix
# a small function to read the counts
read_counts<- function(file){
  x<- read_tsv(file)
  x<- as.data.frame(x)
  genes<- x$Gene
  x<- x[, -1]
  rownames(x)<- genes
  return(as.matrix(x))
}


counts_files<- list.files(here("data/GSE116256"), full.names = TRUE, pattern = "*dem.txt.gz")

samples<- map_chr(counts_files, basename)

samples<- str_replace(samples, "(GSM[0-9]+_.+).dem.txt.gz", "\\1")

names(counts_files)<- samples

# for demonstration, only read in the first 4 samples
counts<- purrr::map(counts_files[1:4], read_counts)
read in the meta data
read_meta<- function(file){
  y<- read_tsv(file)
  y<- as.data.frame(y)
  cells<- y$Cell
  y<- y[,-1]
  rownames(y)<- cells
  return(y)
}


meta_files<- list.files(here("data/GSE116256"), full.names = TRUE, pattern = "*anno.txt.gz")
meta_names<- map_chr(meta_files, basename)

meta_names<- str_replace(meta_names, "(GSM[0-9]+_.+).anno.txt.gz", "\\1")
names(meta_files)<- meta_names

meta<- purrr::map(meta_files[1:4], read_meta)
create a seurat object
library(Matrix) #for sparse matrix
objs<- purrr::map2(counts, meta,
                   ~CreateSeuratObject(counts = as(.x, "sparseMatrix"),
                                       meta.data = .y))


# merge to a single object
merged_seurat<- purrr::reduce(objs, function(x,y) {merge(x,y)})

## free memory
rm(counts)
rm(objs)
rm(meta)
gc()
#> used (Mb) gc trigger (Mb) limit (Mb) max used (Mb)
#> Ncells 3689626 197.1 5497720 293.7 NA 5497720 293.7
#> Vcells 13347305 101.9 99405338 758.5 32768 118504523 904.2standard preprocess of the data
merged_seurat<- merged_seurat %>%
  NormalizeData(normalization.method = "LogNormalize", scale.factor = 10000) %>%
  FindVariableFeatures( selection.method = "vst", nfeatures = 2000) %>%
  ScaleData() %>%
  RunPCA() %>%
  RunHarmony(group.by.vars = "orig.ident", dims.use = 1:30) %>%
  RunUMAP(reduction = "harmony", dims = 1:30) %>%
  FindNeighbors(reduction = "harmony", dims = 1:30) %>%
  FindClusters(resolution = 0.6)
#> Modularity Optimizer version 1.3.0 by Ludo Waltman and Nees Jan van Eck
#>
#> Number of nodes: 2392
#> Number of edges: 128252
#>
#> Running Louvain algorithm...
#> Maximum modularity in 10 random starts: 0.8706
#> Number of communities: 11
#> Elapsed time: 0 secondsvisualization
DimPlot_scCustom(seurat_object = merged_seurat)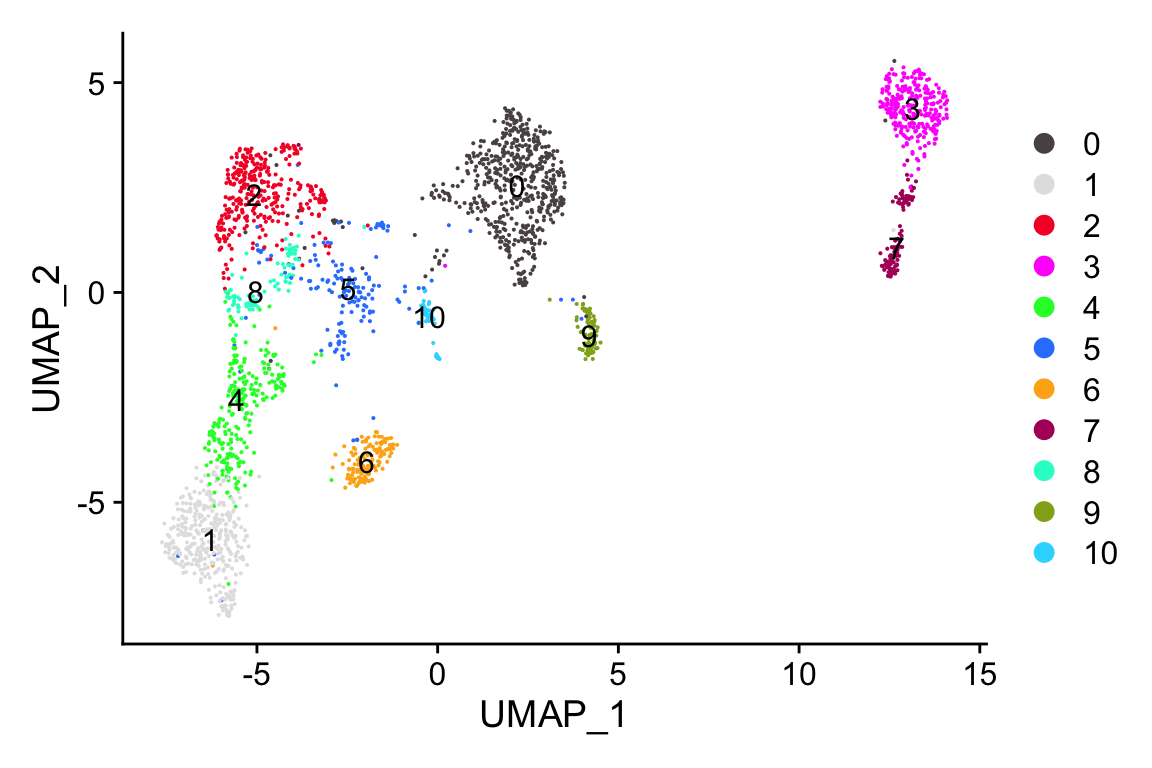
I have a youtube video on this too! subscribe to chatomics!