Single cell matrix is often represented as gene x cell in R/Seurat, but it is represented as cell x gene in python/scanpy.
Let’s use a real example to show how to transpose between the two formats. The GEO accession page is at https://www.ncbi.nlm.nih.gov/geo/query/acc.cgi?acc=GSE154763
Download the data
We can use command line to download the count matrix at ftp: https://ftp.ncbi.nlm.nih.gov/geo/series/GSE154nnn/GSE154763/suppl/
wget https://ftp.ncbi.nlm.nih.gov/geo/series/GSE154nnn/GSE154763/suppl/GSE154763_ESCA_normalized_expression.csv.gz -O ~/blog_data/GSE154763_ESCA_normalized_expression.csv.gz

# decompress the file
gunzip GSE154763_ESCA_normalized_expression.csv.gz

# this GEO matrix is cell x gene
# take a look by https://www.visidata.org/
vd  GSE154763_ESCA_normalized_expression.csv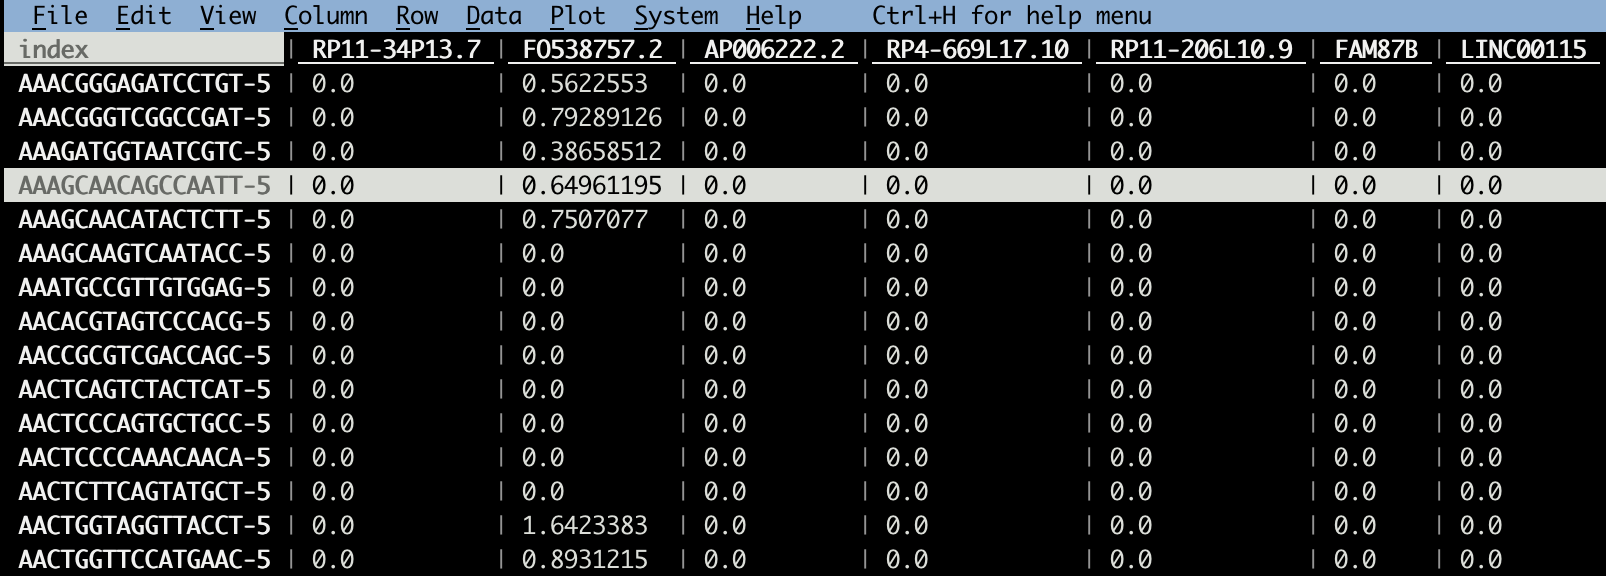
Note, most GEO data I downloaded before is gene x cell, this one is cell x gene.
The data is normalized by logNormalization. Let’s revert back to the raw counts using https://github.com/immunitastx/recover-counts. It uses binary search to find the total count to make the smallest non-zero count one. In other words, it assumes the smallest non-zero value is a count of 1.
wget https://raw.githubusercontent.com/immunitastx/recover-counts/main/recover_counts_from_log_normalized_data.py
chmod u+x recover_counts_from_log_normalized_data.py
mamba install h5py numpy pandas
# by default, the script assumes the input is cell x gene. to specify gene x cell, turn
# on -t
./recover_counts_from_log_normalized_data.py -m 10000 -d CSV GSE154763_ESCA_normalized_expression.csv -o GSE154763_ESCA_counts.csv
vd GSE154763_ESCA_counts.csv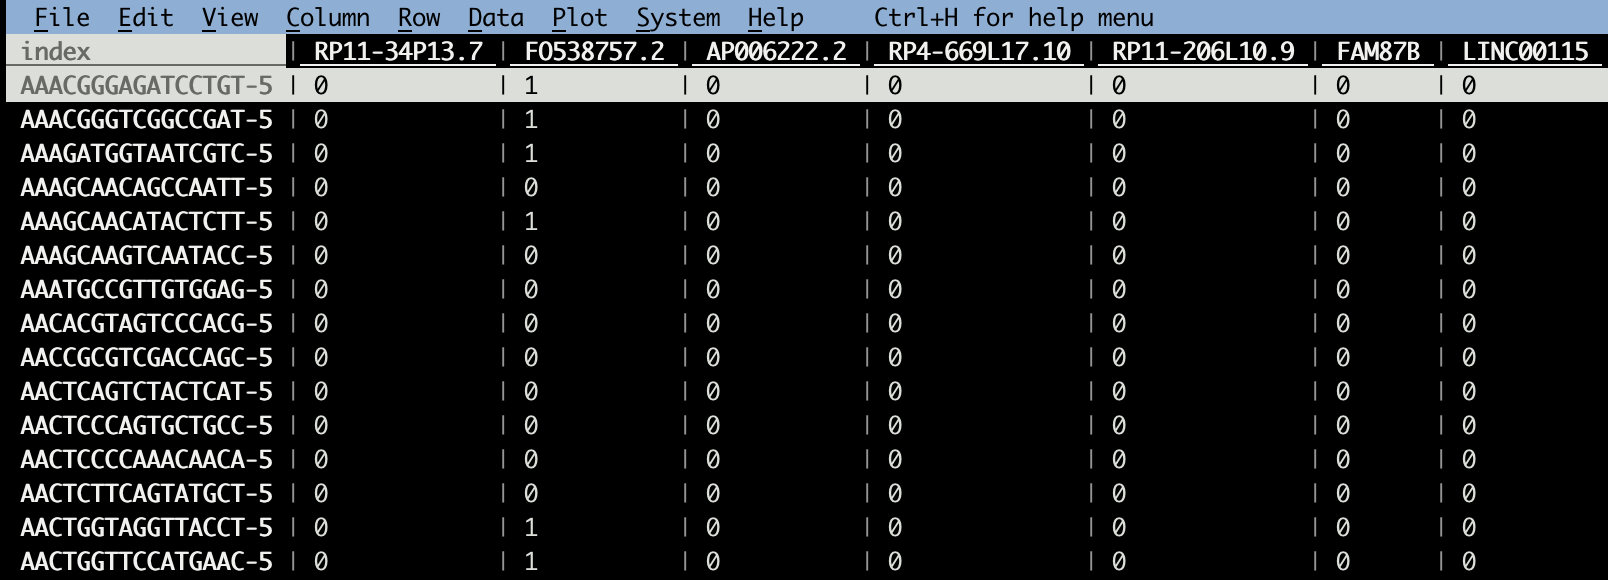 Now the smallest counts are 0s and some are 1s; fewer are > 1.
transpose the dataframe
Read into R:
library(tidyverse)

mat_df<- read_csv("~/blog_data/GSE154763_ESCA_counts.csv")

mat_df[1:5, 1:5]
#> # A tibble: 5 × 5
#> index `RP11-34P13.7` FO538757.2 AP006222.2 `RP4-669L17.10`
#> <chr> <dbl> <dbl> <dbl> <dbl>
#> 1 AAACGGGAGATCCTGT-5 0 1 0 0
#> 2 AAACGGGTCGGCCGAT-5 0 1 0 0
#> 3 AAAGATGGTAATCGTC-5 0 1 0 0
#> 4 AAAGCAACAGCCAATT-5 0 0 0 0
#> 5 AAAGCAACATACTCTT-5 0 1 0 0mat_transposed_df<- mat_df %>%
tidyr::pivot_longer(cols = -1, names_to = "genes") %>%
tidyr::pivot_wider(names_from = index, values_from = value)
mat_transposed_df[1:5, 1:5]#> # A tibble: 5 × 5
#> genes `AAACGGGAGATCC…` `AAACGGGTCGGCC…` `AAAGATGGTAATC…` `AAAGCAACAGCCA…`
#> <chr> <dbl> <dbl> <dbl> <dbl>
#> 1 RP11-34P1… 0 0 0 0
#> 2 FO538757.2 1 1 1 0
#> 3 AP006222.2 0 0 0 0
#> 4 RP4-669L1… 0 0 0 0
#> 5 RP11-206L… 0 0 0 0Now, the dataframe is transposed to gene x cell.
One can also use t() to transpose, but it is used for matrix in R, you will have to make the
dataframe to matrix first
cells<- mat_df$index
mat2<- as.matrix(mat_df[, -1])

rownames(mat2)<- cells

mat2_transpose<- t(mat2)

mat2[1:5, 1:5]
#> RP11-34P13.7 FO538757.2 AP006222.2 RP4-669L17.10
#> AAACGGGAGATCCTGT-5 0 1 0 0
#> AAACGGGTCGGCCGAT-5 0 1 0 0
#> AAAGATGGTAATCGTC-5 0 1 0 0
#> AAAGCAACAGCCAATT-5 0 0 0 0
#> AAAGCAACATACTCTT-5 0 1 0 0
#> RP11-206L10.9
#> AAACGGGAGATCCTGT-5 0
#> AAACGGGTCGGCCGAT-5 0
#> AAAGATGGTAATCGTC-5 0
#> AAAGCAACAGCCAATT-5 0
#> AAAGCAACATACTCTT-5 0make a Seurat object:
genes<- mat_transposed_df$genes
mat<- mat_transposed_df[, -1] %>%
        as.matrix()

rownames(mat)<- genes

library(Seurat)
obj<- CreateSeuratObject(counts = mat)
You see most of the work happens before creating the Seurat object. Once you have a Seurat object, you can use scCustomize to make a lot of nice visualizations.