Are protein and RNA levels correlated? This is a big question.
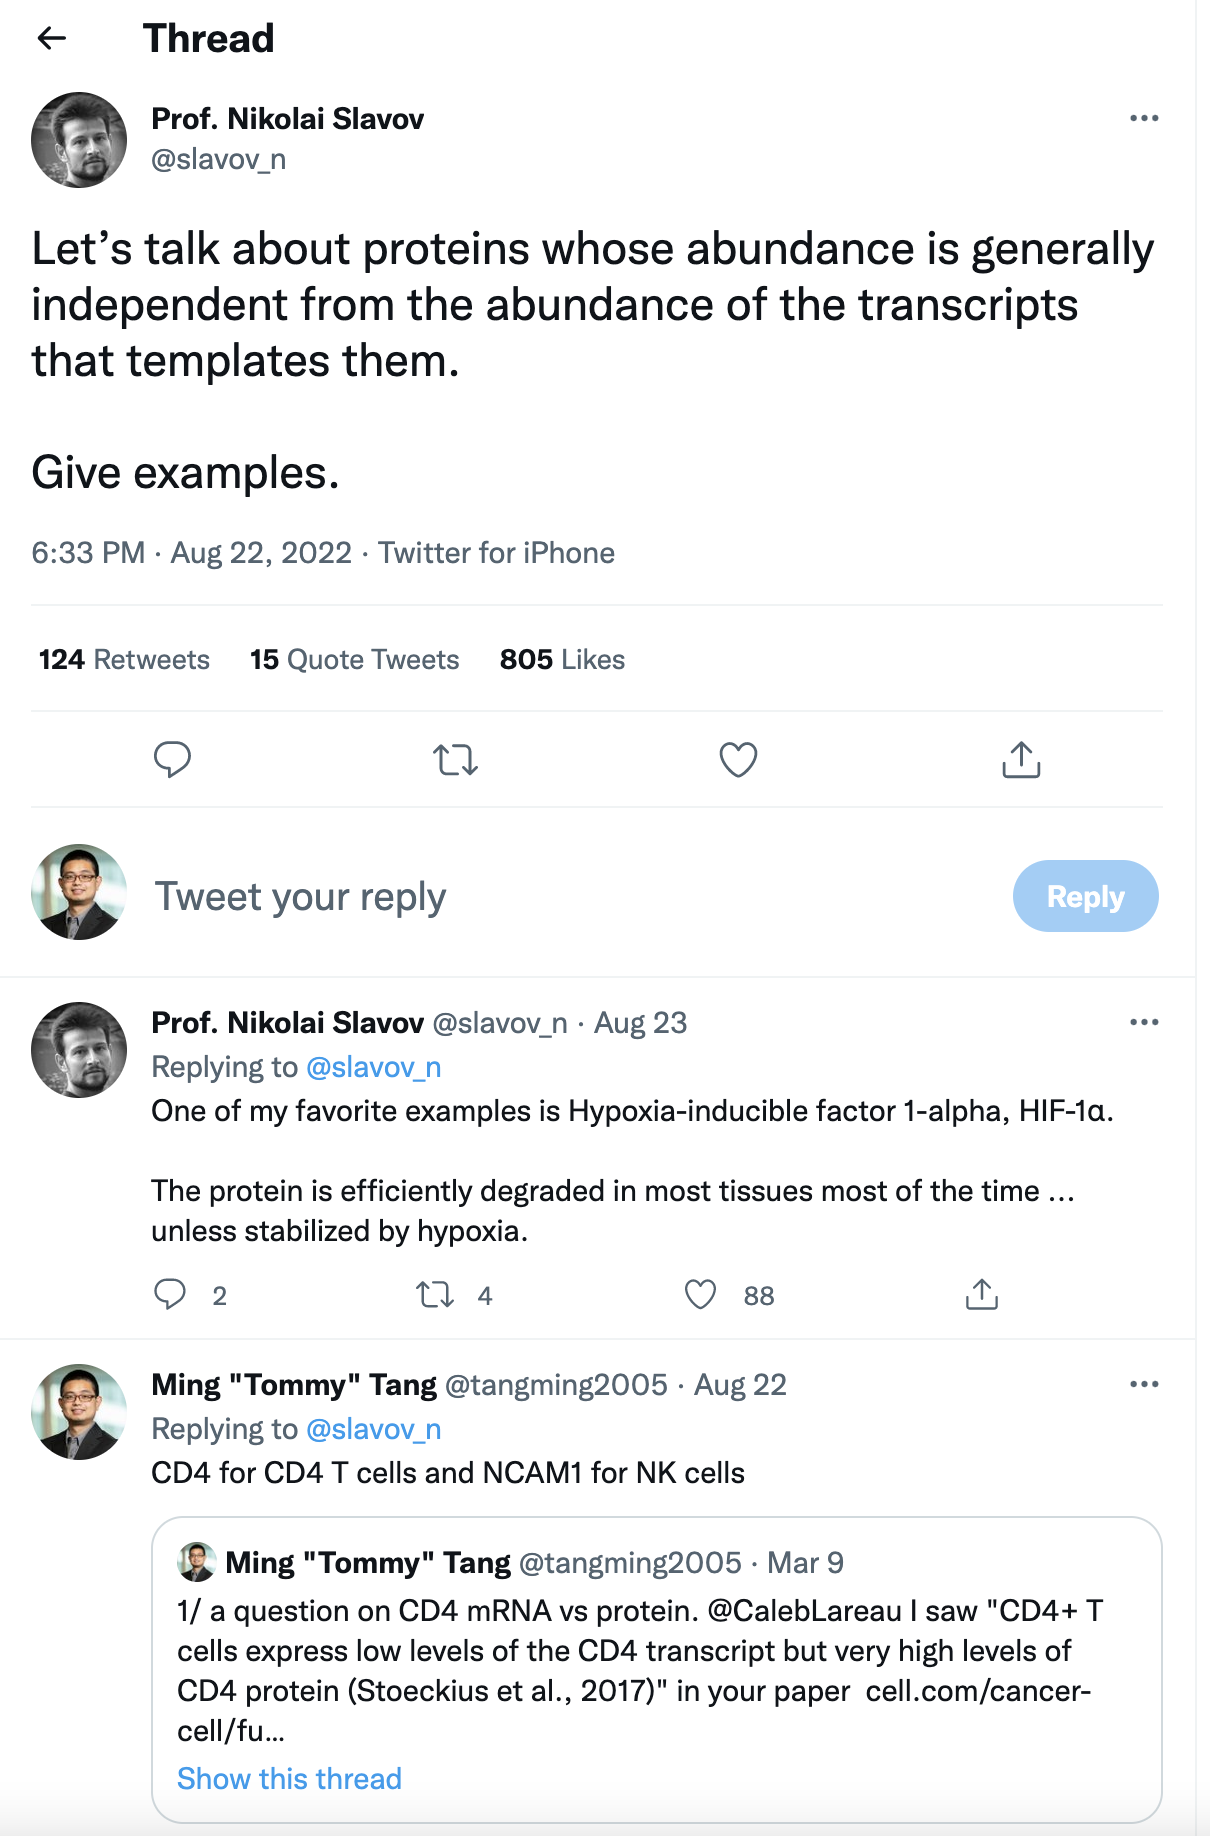
see replies to this tweet at https://twitter.com/slavov_n/status/1561844133496512512. In general, RNA and protein abundances should be correlated but there are exceptions of course. Biology is complicated/weird!
One of my favorite examples is Hypoxia-inducible factor 1-alpha, HIF-1α. The protein is efficiently degraded in most tissues most of the time unless stabilized by hypoxia.
William Kaelin won Nobel prize for his work on how cells sense oxygen through the HIF pathway in 2019.
Coincidentally, my first paper during PhD is on how CTCF functions as an enhancer block to attenuate the HIF1 enhancers.
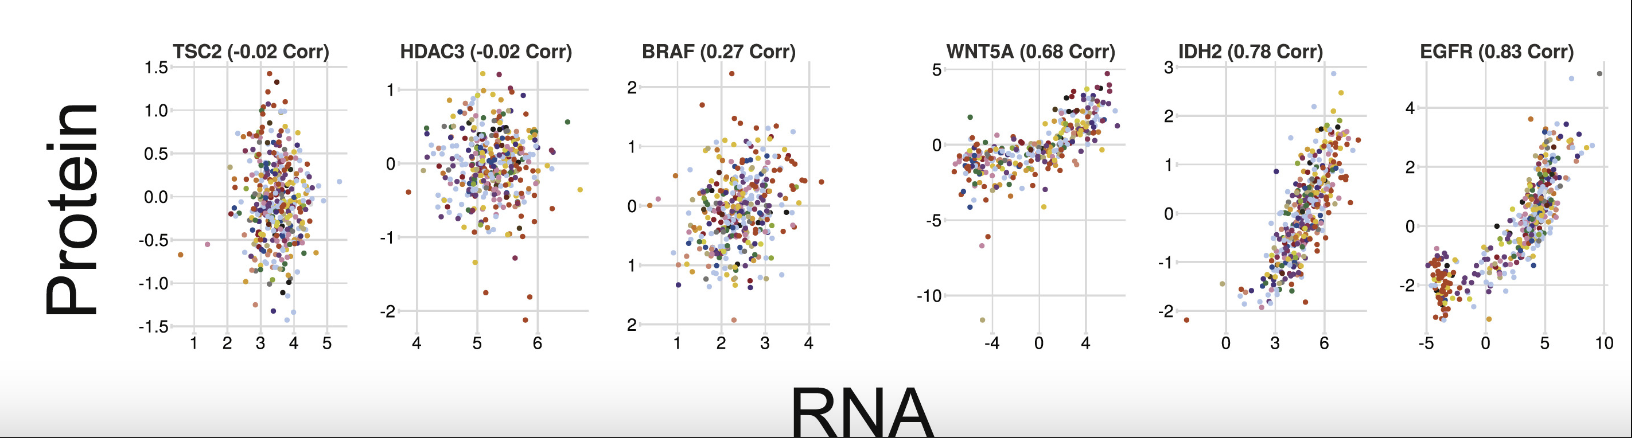
From this paper Quantitative Proteomics of the Cancer Cell Line Encyclopedia, some genes are well-correlated between protein and RNA while others are not.
From this review mRNAs, proteins and the emerging principles of gene expression control:
Therefore, mRNA levels should not be interpreted as the final output of gene expression. Instead, it is more instructive to think of mRNAs as what they mechanistically are: the templates for protein synthesis.
Explore proteomics data
Let’s do some analysis to check if PDL1/CD274’s mRNA and protein are correlated or not across cancer cell lines. PDL1 is the ligand of PD1 and is a prominent immunotherapy target.
The protemomics data are from this paper Pan-cancer proteomic map of 949 human cell lines
Both the RNAseq and the proteomics data were downloaded from https://cellmodelpassports.sanger.ac.uk/downloads
library(tidyverse)
library(janitor)

data<- read_tsv("~/blog_data/protein_matrix_averaged_20220713.tsv", skip = 1)

#remove one more line
data<- data %>%
  dplyr::slice(-1)

data<- data %>%
  dplyr::rename(model_name = symbol) %>%
  dplyr::rename(model_id = `...2`)


head(data)
#> # A tibble: 6 × 8,459
#> model_name model_id `IGLV3-10` TRBV19 `IGHV3OR16-12` `IGHV3OR15-7` TRBV18
#> <chr> <chr> <dbl> <dbl> <dbl> <dbl> <dbl>
#> 1 201T SIDM00055 NA NA NA NA NA
#> 2 22RV1 SIDM00499 NA NA NA NA NA
#> 3 23132-87 SIDM00980 NA NA NA NA NA
#> 4 42-MG-BA SIDM00982 NA NA NA NA NA
#> 5 451Lu SIDM01240 NA NA NA NA NA
#> 6 5637 SIDM00807 NA NA NA NA NA
#> # … with 8,452 more variables: `IGHV3-15` <dbl>, PIGBOS1 <dbl>,
#> # `IGHV1-3` <dbl>, `IGHV1-18` <dbl>, NBDY <dbl>, MMP24OS <dbl>,
#> # ZC3H11B <dbl>, GOLGA6L7 <dbl>, TLE7 <dbl>, RBM47 <dbl>, UBA6 <dbl>,
#> # ESYT2 <dbl>, MED19 <dbl>, SHTN1 <dbl>, TMEM223 <dbl>, BICDL2 <dbl>,
#> # MEX3A <dbl>, ILVBL <dbl>, C1orf226 <dbl>, PLEKHG3 <dbl>, SH3PXD2B <dbl>,
#> # ZC3H12D <dbl>, WDR27 <dbl>, NBAS <dbl>, FAM234B <dbl>, FUOM <dbl>,
#> # VWA8 <dbl>, SBNO1 <dbl>, GTPBP10 <dbl>, WDR91 <dbl>, KLRG2 <dbl>, …so each row is a cell line, and each column is a gene. It also has a model_id column that the consortium use internally.
read in the metadata:
meta<- read_csv("~/blog_data/model_list_20220628.csv")

head(meta)
#> # A tibble: 6 × 97
#> model_id sample_id patient_id parent_id model_name synonyms tissue cancer_type
#> <chr> <chr> <chr> <chr> <chr> <chr> <chr> <chr>
#> 1 SIDM017… SIDS01659 SIDP01578 <NA> PK-59 <NA> Pancr… Pancreatic…
#> 2 SIDM001… SIDS00612 SIDP00541 <NA> SNU-1033 <NA> Large… Colorectal…
#> 3 SIDM014… SIDS01466 SIDP01347 <NA> SNU-466 <NA> Centr… Glioblasto…
#> 4 SIDM015… SIDS01363 SIDP01247 <NA> IST-MES-2 <NA> Lung Mesothelio…
#> 5 SIDM016… SIDS01631 SIDP01557 <NA> MUTZ-5 <NA> Haema… B-Lymphobl…
#> 6 SIDM014… SIDS01493 SIDP01374 <NA> TM-31 <NA> Centr… Glioma
#> # … with 89 more variables: cancer_type_ncit_id <chr>, tissue_status <chr>,
#> # sample_site <chr>, cancer_type_detail <chr>, model_type <chr>,
#> # growth_properties <chr>, model_treatment <chr>, sampling_day <dbl>,
#> # sampling_month <dbl>, sampling_year <dbl>, doi <chr>, pmed <dbl>,
#> # msi_status <chr>, ploidy_snp6 <dbl>, ploidy_wes <dbl>, ploidy_wgs <dbl>,
#> # mutational_burden <dbl>, model_comments <chr>,
#> # model_relations_comment <chr>, COSMIC_ID <chr>, BROAD_ID <chr>, …dim(meta)#> [1] 2078 97Sanity check if model_id and model_name are 1:1 mapping or not.
## model_id and model_name are not 1:1 mapping
meta %>% select(model_id, model_name) %>%
        distinct(model_name) %>%
        dim()
#> [1] 2075 1## three same cell line has duplicated lines
meta %>%
count(model_name) %>%
dplyr::filter(n >1)#> # A tibble: 3 × 2
#> model_name n
#> <chr> <int>
#> 1 ML-1 2
#> 2 MS-1 2
#> 3 SLR24 2## model id is unique, but not the model_name
meta %>%
dplyr::filter(model_name %in% c("ML-1", "MS-1", "SLR24"))#> # A tibble: 6 × 97
#> model_id sample_id patient_id parent_id model_name synonyms tissue cancer_type
#> <chr> <chr> <chr> <chr> <chr> <chr> <chr> <chr>
#> 1 SIDM004… SIDS01183 SIDP01069 <NA> MS-1 <NA> Skin Other Soli…
#> 2 SIDM002… SIDS00693 SIDP00619 <NA> MS-1 MS-1-L Lung Small Cell…
#> 3 SIDM004… SIDS01117 SIDP01005 <NA> ML-1 <NA> Haema… Acute Myel…
#> 4 SIDM004… SIDS01115 SIDP01004 <NA> ML-1 <NA> Thyro… Thyroid Gl…
#> 5 SIDM013… SIDS01455 SIDP01336 <NA> SLR24 <NA> Kidney Kidney Car…
#> 6 SIDM019… SIDS01788 SIDP01690 SIDM01851 SLR24 <NA> Kidney Kidney Car…
#> # … with 89 more variables: cancer_type_ncit_id <chr>, tissue_status <chr>,
#> # sample_site <chr>, cancer_type_detail <chr>, model_type <chr>,
#> # growth_properties <chr>, model_treatment <chr>, sampling_day <dbl>,
#> # sampling_month <dbl>, sampling_year <dbl>, doi <chr>, pmed <dbl>,
#> # msi_status <chr>, ploidy_snp6 <dbl>, ploidy_wes <dbl>, ploidy_wgs <dbl>,
#> # mutational_burden <dbl>, model_comments <chr>,
#> # model_relations_comment <chr>, COSMIC_ID <chr>, BROAD_ID <chr>, …Those lines have the same model_name but from different patients so a different model_id.
head(data)#> # A tibble: 6 × 8,459
#> model_name model_id `IGLV3-10` TRBV19 `IGHV3OR16-12` `IGHV3OR15-7` TRBV18
#> <chr> <chr> <dbl> <dbl> <dbl> <dbl> <dbl>
#> 1 201T SIDM00055 NA NA NA NA NA
#> 2 22RV1 SIDM00499 NA NA NA NA NA
#> 3 23132-87 SIDM00980 NA NA NA NA NA
#> 4 42-MG-BA SIDM00982 NA NA NA NA NA
#> 5 451Lu SIDM01240 NA NA NA NA NA
#> 6 5637 SIDM00807 NA NA NA NA NA
#> # … with 8,452 more variables: `IGHV3-15` <dbl>, PIGBOS1 <dbl>,
#> # `IGHV1-3` <dbl>, `IGHV1-18` <dbl>, NBDY <dbl>, MMP24OS <dbl>,
#> # ZC3H11B <dbl>, GOLGA6L7 <dbl>, TLE7 <dbl>, RBM47 <dbl>, UBA6 <dbl>,
#> # ESYT2 <dbl>, MED19 <dbl>, SHTN1 <dbl>, TMEM223 <dbl>, BICDL2 <dbl>,
#> # MEX3A <dbl>, ILVBL <dbl>, C1orf226 <dbl>, PLEKHG3 <dbl>, SH3PXD2B <dbl>,
#> # ZC3H12D <dbl>, WDR27 <dbl>, NBAS <dbl>, FAM234B <dbl>, FUOM <dbl>,
#> # VWA8 <dbl>, SBNO1 <dbl>, GTPBP10 <dbl>, WDR91 <dbl>, KLRG2 <dbl>, …exp_data<- data[, c("model_name", "model_id", "CD274")] %>%
left_join(meta)
head(exp_data)#> # A tibble: 6 × 98
#> model_name model_id CD274 sample_id patient_id parent_id synonyms tissue
#> <chr> <chr> <dbl> <chr> <chr> <chr> <chr> <chr>
#> 1 201T SIDM00055 NA SIDS00744 SIDP00668 <NA> <NA> Lung
#> 2 22RV1 SIDM00499 NA SIDS00942 SIDP00842 <NA> CWR22-Rv1;CW… Prost…
#> 3 23132-87 SIDM00980 NA SIDS00443 SIDP00380 <NA> St 23132 Stoma…
#> 4 42-MG-BA SIDM00982 NA SIDS00444 SIDP00381 <NA> <NA> Centr…
#> 5 451Lu SIDM01240 NA SIDS00062 SIDP00048 SIDM00802 WM 451-Lu;WC… Skin
#> 6 5637 SIDM00807 NA SIDS00057 SIDP00045 <NA> <NA> Bladd…
#> # … with 90 more variables: cancer_type <chr>, cancer_type_ncit_id <chr>,
#> # tissue_status <chr>, sample_site <chr>, cancer_type_detail <chr>,
#> # model_type <chr>, growth_properties <chr>, model_treatment <chr>,
#> # sampling_day <dbl>, sampling_month <dbl>, sampling_year <dbl>, doi <chr>,
#> # pmed <dbl>, msi_status <chr>, ploidy_snp6 <dbl>, ploidy_wes <dbl>,
#> # ploidy_wgs <dbl>, mutational_burden <dbl>, model_comments <chr>,
#> # model_relations_comment <chr>, COSMIC_ID <chr>, BROAD_ID <chr>, …table(is.na(exp_data$CD274))#>
#> FALSE TRUE
#> 159 790only 159 lines with PDL1 expression at protein level.
# distribution of the PDL1 protein level
exp_data %>%
        dplyr::filter(!is.na(CD274)) %>%
        ggplot(aes(x= CD274)) +
        geom_histogram(bins = 30, color = "white") +
        ggtitle("PDL1 expression histogram") +
        theme_classic(base_size = 14)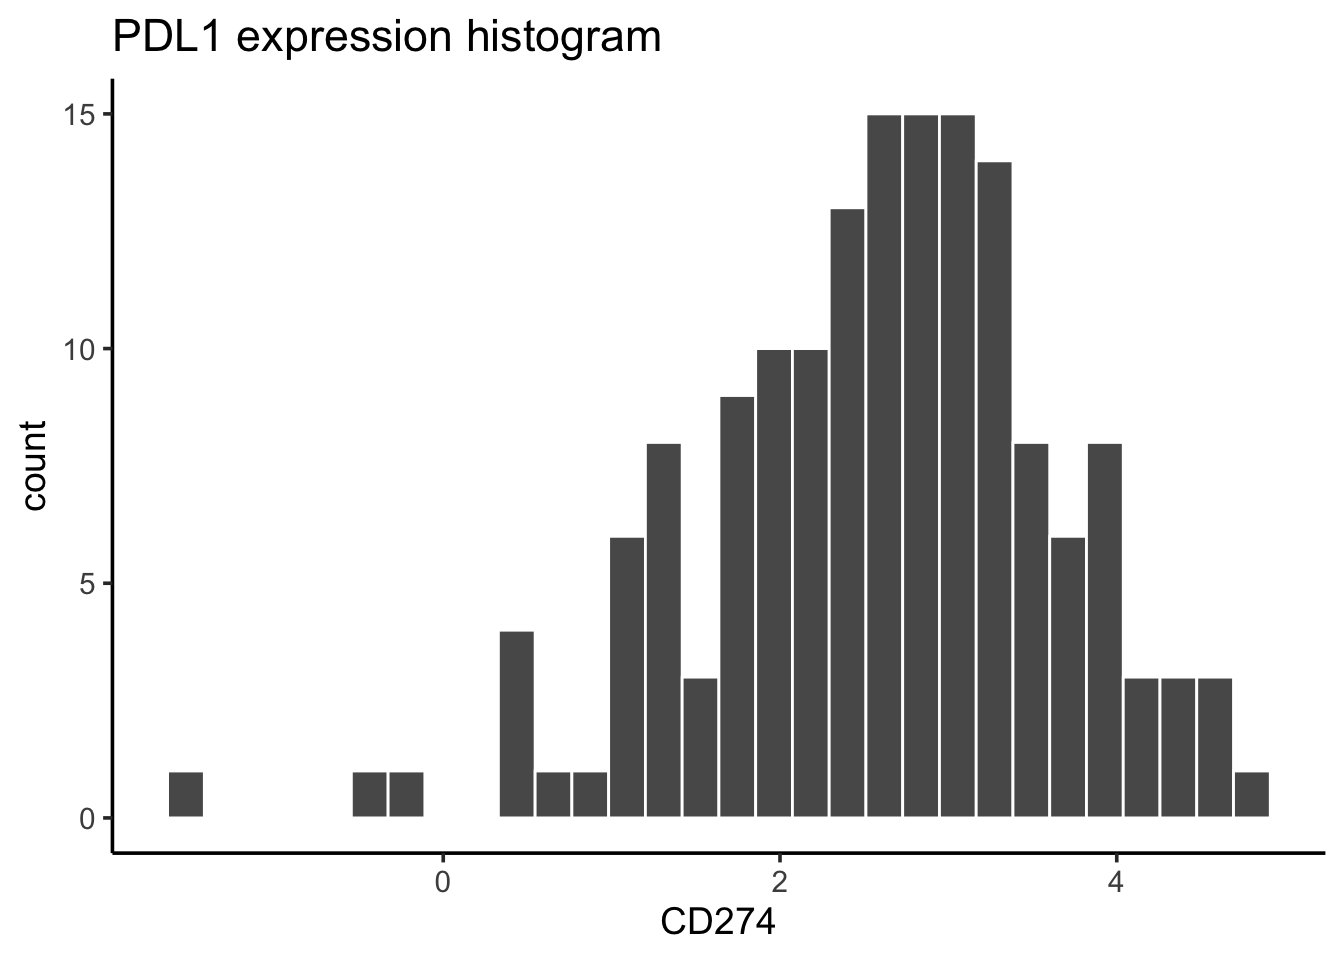
p<- exp_data %>%
        dplyr::filter(!is.na(CD274)) %>%
        ggplot(aes(x = cancer_type, y= CD274 ,text = paste(cancer_type, model_name, sep=":"))) +
        geom_boxplot() +
        geom_point() +
        theme_classic(base_size = 14) +
        theme(axis.text.x = element_text(angle = 90, vjust = 0.5, hjust=1))

library(plotly)

ggplot_p<- ggplotly(p)
ggplot_p
#save the interactive plots
#htmlwidgets::saveWidget(ggplot_p, here("data/Proteomics_20220713/PDL1_proteomics_cell_line_20220718.html"), selfcontained = T)read in the RNAseq data:
rna<- read_csv("~/blog_data/rnaseq_tpm_20220624.csv")

rna<- rna %>%
        dplyr::slice(5: nrow(rna)) %>%
        dplyr::rename(gene = `...2`) %>%
        dplyr::select(-model_id) %>%
        dplyr::mutate(across(!gene, as.numeric))

head(rna)
#> # A tibble: 6 × 1,432
#> gene SIDM00001 SIDM00002 SIDM00003 SIDM00005 SIDM00006 SIDM00007 SIDM00008
#> <chr> <dbl> <dbl> <dbl> <dbl> <dbl> <dbl> <dbl>
#> 1 A1BG 0.53 0.78 0.49 3.29 0.56 1.43 0
#> 2 A1BG-AS1 2.43 6.01 11.5 7.71 7.53 16.2 0.06
#> 3 A1CF 0.03 0 0 0 0.04 0 0.06
#> 4 A2M 0.33 0.75 29.1 0.87 86.2 0.07 0.06
#> 5 A2M-AS1 0 0.71 0.83 5.59 1.04 1.67 0.06
#> 6 A2ML1 0 0.57 0 0.19 0 0 0.32
#> # … with 1,424 more variables: SIDM00009 <dbl>, SIDM00011 <dbl>,
#> # SIDM00014 <dbl>, SIDM00015 <dbl>, SIDM00016 <dbl>, SIDM00017 <dbl>,
#> # SIDM00018 <dbl>, SIDM00023 <dbl>, SIDM00025 <dbl>, SIDM00026 <dbl>,
#> # SIDM00027 <dbl>, SIDM00029 <dbl>, SIDM00032 <dbl>, SIDM00036 <dbl>,
#> # SIDM00040 <dbl>, SIDM00041 <dbl>, SIDM00042 <dbl>, SIDM00043 <dbl>,
#> # SIDM00044 <dbl>, SIDM00045 <dbl>, SIDM00046 <dbl>, SIDM00047 <dbl>,
#> # SIDM00048 <dbl>, SIDM00049 <dbl>, SIDM00050 <dbl>, SIDM00051 <dbl>, …PDL1_rna_tpm<- rna %>%
dplyr::filter(gene == "CD274") %>%
pivot_longer(! gene, names_to = "model_id", values_to = "tpm") %>%
pivot_wider(names_from = gene, values_from = tpm) %>%
select(model_id, CD274)
PDL1_rna_tpm<- dplyr::rename(PDL1_rna_tpm, CD274_rna = CD274)
head(PDL1_rna_tpm)#> # A tibble: 6 × 2
#> model_id CD274_rna
#> <chr> <dbl>
#> 1 SIDM00001 17.3
#> 2 SIDM00002 0.04
#> 3 SIDM00003 1
#> 4 SIDM00005 1.78
#> 5 SIDM00006 2.41
#> 6 SIDM00007 36.9exp_data<- dplyr::rename(exp_data, CD274_protein = CD274)If we only include cell lines with both protein and RNA expression, we see the protein and RNA are positively correlated.
left_join(exp_data, PDL1_rna_tpm) %>%
        dplyr::select(model_name, model_id, CD274_protein, CD274_rna, everything()) %>%
        dplyr::filter(!is.na(CD274_protein), !is.na(CD274_rna)) %>%
        arrange(desc(CD274_protein)) %>%
        ggplot(aes(x=CD274_rna, y = CD274_protein)) +
        scale_x_continuous(trans=scales::pseudo_log_trans(base = 2))+
        geom_point() +
        geom_smooth(method= "lm") +
        theme_classic(base_size = 14)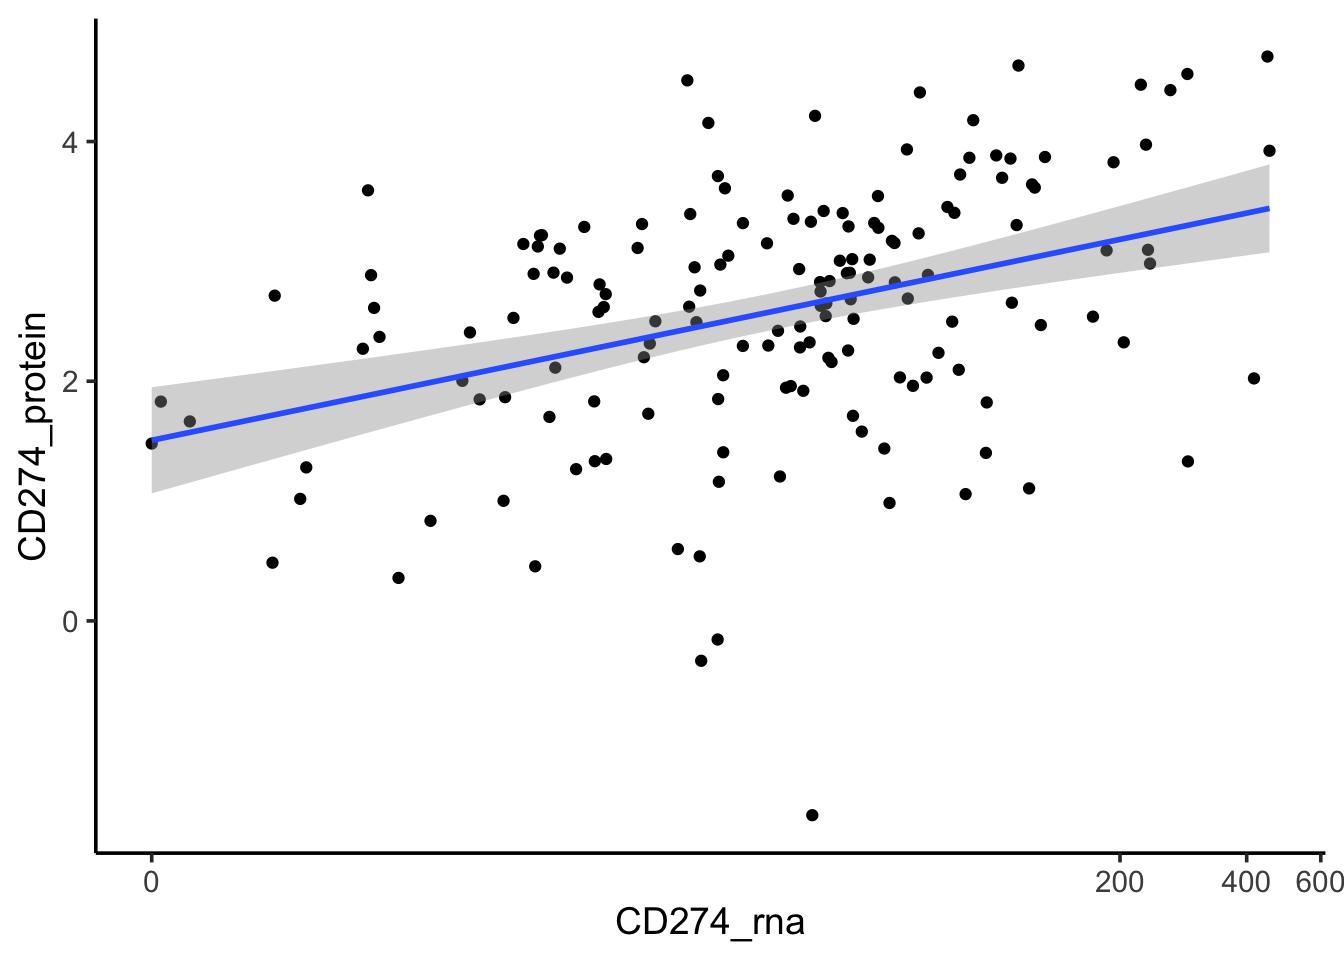
Let’s include all cell lines and designate the NAs to 0s.
p2<- left_join(exp_data, PDL1_rna_tpm) %>%
        dplyr::select(model_name, model_id, CD274_protein, CD274_rna, everything()) %>%
        dplyr::arrange(desc(CD274_protein)) %>%
        dplyr::mutate(CD274_rna = if_else(is.na(CD274_rna), 0, CD274_rna)) %>%
        dplyr::mutate(CD274_protein = if_else(is.na(CD274_protein), 0, CD274_protein)) %>%
        ggplot(aes(x= CD274_rna, y = CD274_protein, text = paste(model_name, cancer_type, sep =":"))) +
        geom_point() +
        scale_x_continuous(trans=scales::pseudo_log_trans(base = 2), breaks = c(0, 2, 4, 8, 16, 32, 64, 100, 200, 400, 600))+
        geom_smooth(method= "lm") +
        theme_classic(base_size = 14)


ggplot_p2<- ggplotly(p2)

ggplot_p2
We see a bunch of cell lines with 0 protein level expression but have some levels of RNA expression. Are the NAs in the proteomics data means PDL1 is not detected or not assayed?
And what’s going on for MDA-MB-231 breast cancer cell line in the bottom? it has high RNA expression level but the protein is very low. Also, PC-3 (non-small cell lung cancer) and D-245MG (glioblastoma) cell line have decent protein expression but no RNA expression. I guess it is a technical problem.