I was writing an R script to plot the ATACseq fragment length distribution and wanted to turn the R script to a command line utility.
I then (re)discovered this awesome docopt.R.
One just needs to write the help message the you want to display and docopt() will
parse the options, arguments and return a named list which can be accessed inside the
R script. check http://docopt.org/ for more information as well.
See below for an example. You can download it at https://github.com/crazyhottommy/scATACutils/blob/master/R/plot_atac_frag_distribution.R
#! /usr/bin/env Rscript
'Plot fragment length distribution from ATACseq data
Usage:
plot_atac_fragment_len_distribution.R (--poly | --hist) (--pdf | --png) [--width=<width> --height=<height> --bin=<bp>] <input> <output>
Options:
-h --help Show this screen.
-v --version Show version.
--bin=<bp> Bin size [default: 5]
--poly Plot frequency polygon.
--hist Plot histogram.
--pdf Save to pdf.
--png Save to png.
--width=<width> Width of the output [default: 4]
--height=<height> Height of the output [default: 4]
Arguments:
input fragment length in a one column dataframe without header or stdin
output output filename
' -> doc
suppressMessages(library(ggplot2))
# check this awesome docoptR https://github.com/docopt/docopt.R
## make sure use the development version, the CRAN version not working for me
# library(devtools)
# devtools::install_github("docopt/docopt.R")
suppressMessages(library(docopt))
suppressMessages(library(dplyr))
# this will give error if try interactively, because no input and output argument are given
# https://github.com/docopt/docopt.R/issues/27
arguments <- docopt(doc, version = 'plot_atac_frag_distribution v1.0\n\n')
# for testing interactively
#arguments <- docopt(doc, version = 'FragmentSizeDistribution v1.0', args = c("scripts/fragment3.txt","my.pdf"))
#print(arguments)
## File Read ##
# taken from https://stackoverflow.com/questions/26152998/how-to-make-r-script-takes-input-from-pipe-and-user-given-parameter
# if the input is stdin one can do
# cat fragment.txt | ./plot_atac_frag_distribution.R --poly --pdf stdin out.pdf
# cat fragment.txt | ./plot_atac_frag_distribution.R --poly --pdf - out.pdf
# ./plot_atac_frag_distribution.R --poly --pdf <(cat fragment.txt) out.pdf
OpenRead <- function(arg) {
if (arg %in% c("-", "/dev/stdin")) {
file("stdin", open = "r")
} else if (grepl("^/dev/fd/", arg)) {
fifo(arg, open = "r")
} else {
file(arg, open = "r")
}
}
dat.con <- OpenRead(arguments$input)
fragment <- read.table(dat.con, header = FALSE)
#fragment<- read.table(arguments$input, header = F)
names(fragment)<- c("length")
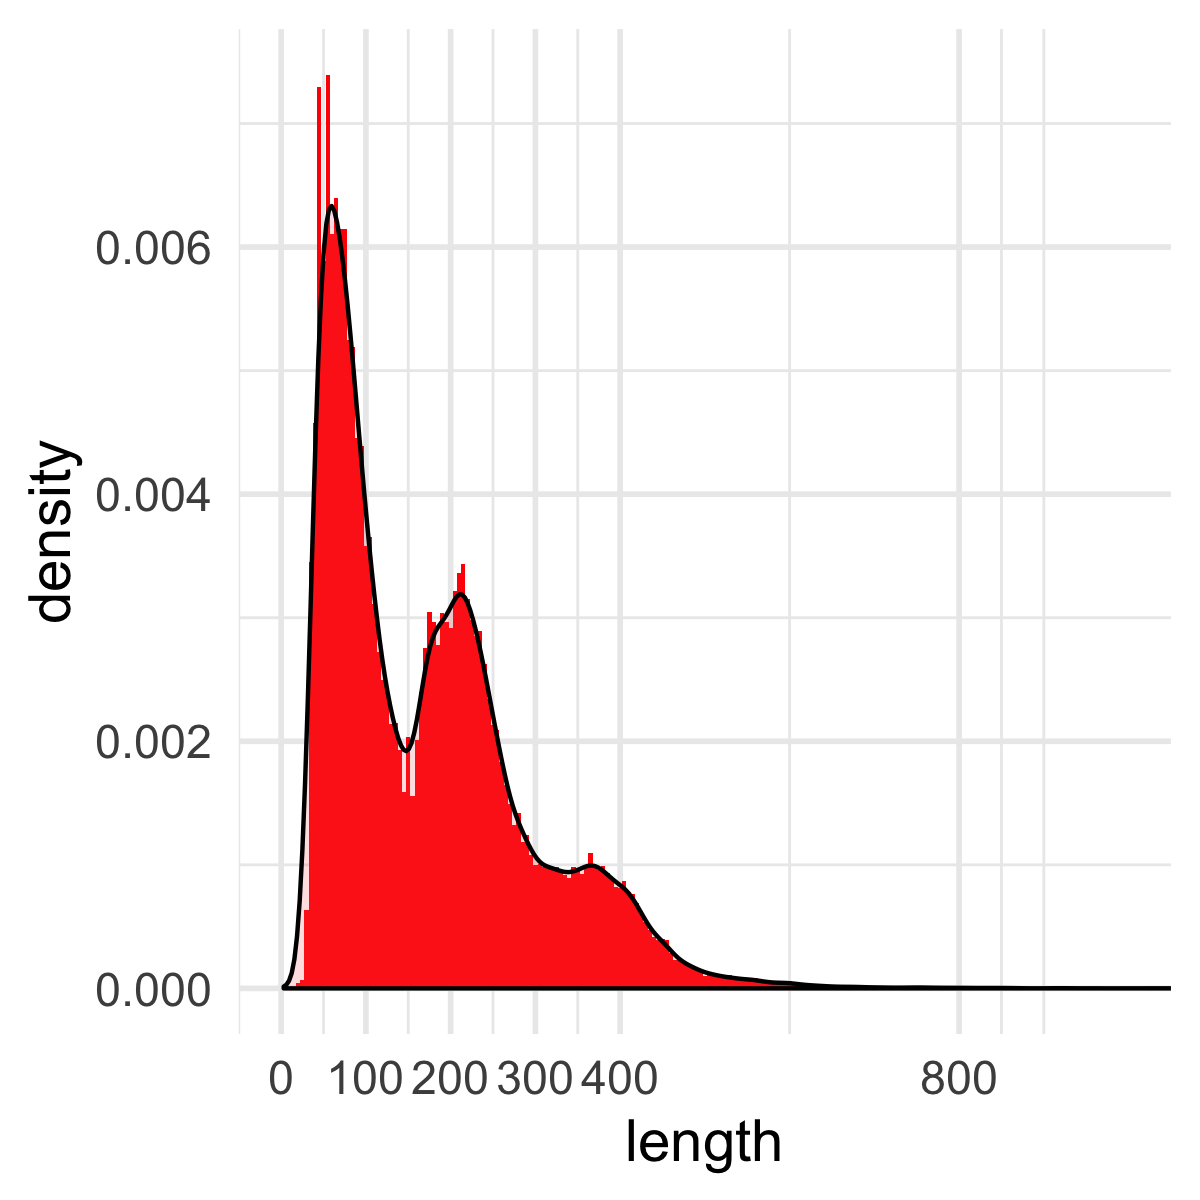
plot_hist<- function(fragment, bin) {
g<- ggplot(fragment %>% filter(length <=2000), aes(x = length)) +
geom_histogram(binwidth = bin, aes(y=..density..), fill = "red") +
geom_density(alpha=.2, fill="#FF6666", col = "black") +
coord_cartesian(xlim = c(0,1000)) +
scale_x_continuous(breaks = c(0, 100, 200, 300, 400, 800)) +
theme_minimal(base_size = 14)
return(g)
}
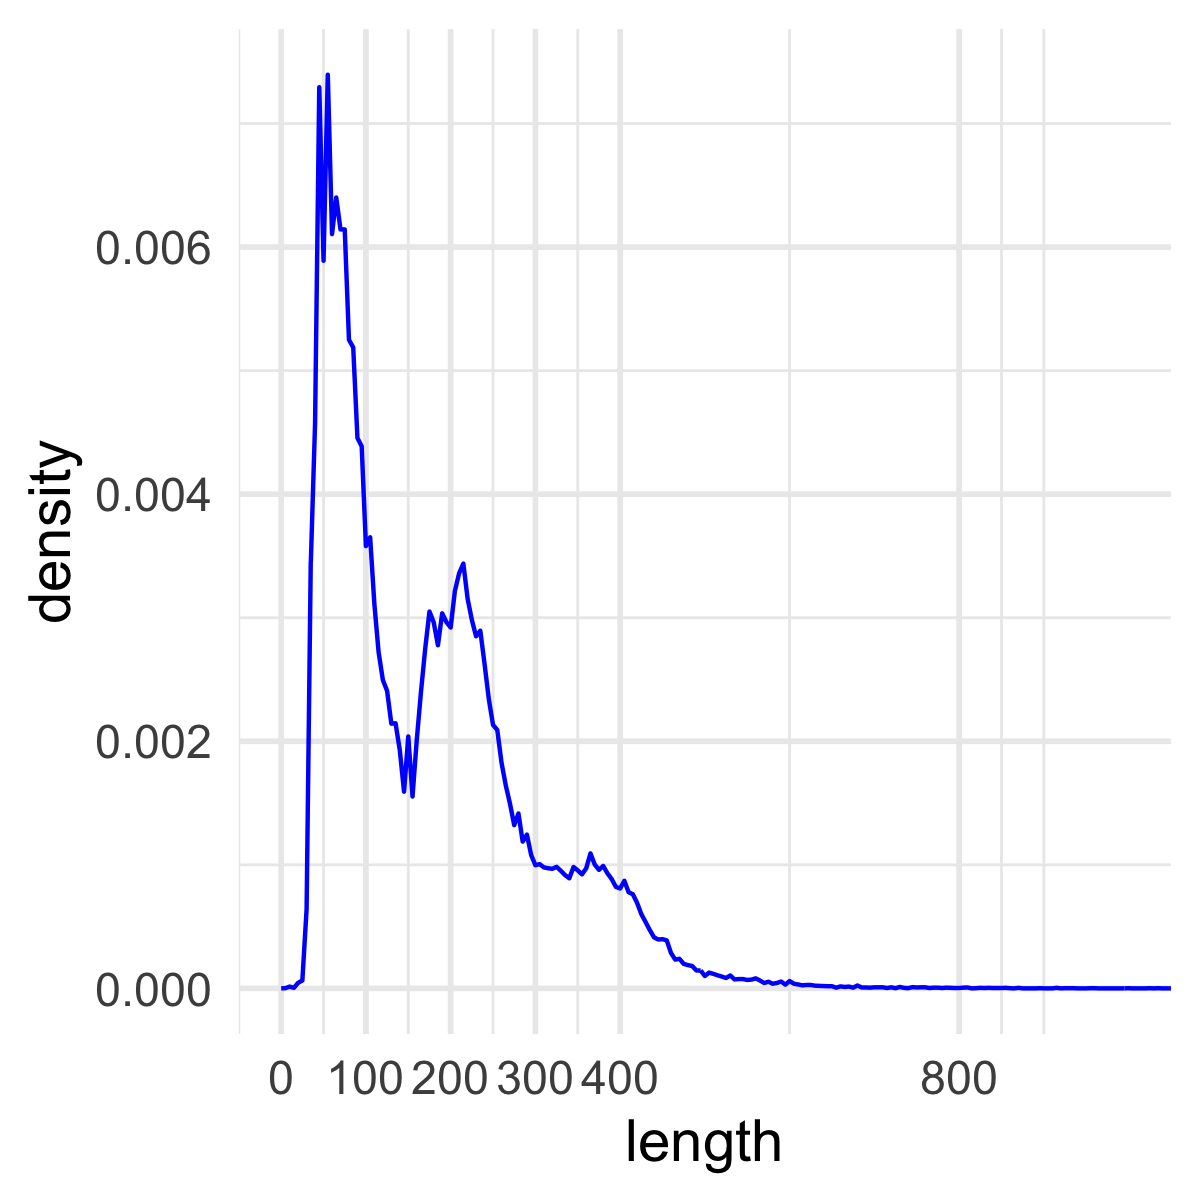
plot_polygon<- function(fragment, bin){
g<- ggplot(fragment %>% filter(length <=2000), aes(x = length, stat(density))) +
geom_freqpoly(binwidth = bin, col = "blue") +
coord_cartesian(xlim = c(0,1000)) +
scale_x_continuous(breaks = c(0, 100, 200, 300, 400, 800)) +
theme_minimal(base_size = 14)
return(g)
}
main<- function(fragment, arguments){
if (arguments$poly){
g<- plot_polygon(fragment, as.numeric(arguments$bin))
} else if (arguments$hist){
g<- plot_hist(fragment, as.numeric(arguments$bin))
}
device<- ifelse(arguments$pdf, "pdf", "png")
ggsave(arguments$output, plot = g, device = device, width =as.numeric(arguments$width),
height = as.numeric(arguments$height) )
}
main(fragment, arguments)
save it to plot_atac_frag_distribution.R.
on command line, one can do:
./plot_atac_frag_distribution.R -h
Plot fragment length distribution from ATACseq data
Usage:
    plot_atac_fragment_len_distribution.R (--poly | --hist) (--pdf | --png) [--width=<width> --height=<height> --bin=<bp>] <input> <output>

Options:
    -h --help  Show this screen.
    -v --version  Show version.
    --bin=<bp>  Bin size [default: 5]
    --poly  Plot frequency polygon.
    --hist  Plot histogram.
    --pdf  Save to pdf.
    --png  Save to png.
    --width=<width>  Width of the output [default: 4]
    --height=<height> Height of the output [default: 4]

Arguments:
    input  fragment length in a one column dataframe without header or stdin
    output  output filename

./plot_atac_frag_distribution.R --poly --png  --bin 10 fragment.txt out.png
cat fragment.txt | ./plot_atac_frag_distribution.R --poly --pdf stdin  out.pdf
cat fragment.txt | ./plot_atac_frag_distribution.R --hist --pdf - out.pdf
./plot_atac_frag_distribution.R --hist --pdf <(cat fragment.txt)  out.pdf

samtools view my.bam | awk '$9>0' | cut -f 9 |./plot_atac_frag_distribution.R --poly --pdf - out.pdf
histogram:
polygon:
 Pretty cool!!
Important notes:
- [default: 4] The space after
:is needed. - use two spaces to separate the option and the explanation
- use four spaces to indent
- use the development version of optdoc.R
- when testing interactively. docopt() may give error when the mandatory arguments are not specified, but running on command line is fine.
see https://github.com/docopt/docopt.R/issues/24
Also check littler
littler provides the r program, a simplified command-line interface for GNU R. This allows direct execution of commands, use in piping where the output of one program supplies the input of the next, as well as adding the ability for writing hash-bang scripts, i.e. creating executable files starting with, say, #!/usr/bin/r.