To not miss a post like this, sign up for my newsletter to learn computational biology and bioinformatics.
In my last blog post, I showed you how to download TCGA RNAseq count data and do PCA and make a heatmap. It is interesting to see some of the LUSC samples mix with the LUAD samples and vice versa.
In this post, we will continue to use PCA to do more Exploratory data analysis (EDA).
Let’s further investigate those samples and use the rank matrix derived from the count matrix to do PCA.
Download and combine the data
The following code is the same as my last post.
It takes long time to download the data, so I saved it as and Rdata.
library(TCGAbiolinks)
library(SummarizedExperiment)
library(dplyr)
library(here)
Download TCGA data using TCGAbiolinks.
# Load TCGA data (example for LUAD - Lung Adenocarcinoma)
LUAD_query <- GDCquery(project = "TCGA-LUAD",
                  data.category = "Transcriptome Profiling",
                  data.type = "Gene Expression Quantification",
                  workflow.type = "STAR - Counts")

GDCdownload(LUAD_query)

# this returns a summarizedExperiment object
TCGA_LUAD_data <- GDCprepare(LUAD_query)

saveRDS(TCGA_LUAD_data, "~/blog_data/TCGA_LUAD_SummarizedExperiment.rds"))
Read in the saved RDS file:
TCGA_LUAD_data<- readRDS("~/blog_data/TCGA_LUAD_SummarizedExperiment.rds")
TCGA_LUAD_mat<- assay(TCGA_LUAD_data)
dim(TCGA_LUAD_mat)
#> [1] 60660 600We have 600 samples.
You noticed that the gene name is in ENSEMBLE ID.
We will download the TCGA LUSC data in the same way.
LUSC_query <- GDCquery(project = "TCGA-LUSC",
                  data.category = "Transcriptome Profiling",
                  data.type = "Gene Expression Quantification",
                  workflow.type = "STAR - Counts")

GDCdownload(LUSC_query)

TCGA_LUSC_data <- GDCprepare(LUSC_query)

saveRDS(TCGA_LUSC_data, "~/blog_data/TCGA_LUSC_SummarizedExperiment.rds"))
read in the saved RDS
TCGA_LUSC_data<- readRDS("~/blog_data/TCGA_LUSC_SummarizedExperiment.rds")

TCGA_LUSC_mat<- assay(TCGA_LUSC_data)

dim(TCGA_LUSC_mat)
#> [1] 60660 553convert ENSEMBL id to gene symbols
library(org.Hs.eg.db)

# remove the version number in the end of the ENSEMBL id
TCGA_LUAD_genes<- rownames(TCGA_LUAD_mat) %>%
  tibble::enframe() %>%
  mutate(ENSEMBL =stringr::str_replace(value, "\\.[0-9]+", ""))

head(TCGA_LUAD_genes)
#> # A tibble: 6 × 3
#> name value ENSEMBL
#> <int> <chr> <chr>
#> 1 1 ENSG00000000003.15 ENSG00000000003
#> 2 2 ENSG00000000005.6 ENSG00000000005
#> 3 3 ENSG00000000419.13 ENSG00000000419
#> 4 4 ENSG00000000457.14 ENSG00000000457
#> 5 5 ENSG00000000460.17 ENSG00000000460
#> 6 6 ENSG00000000938.13 ENSG00000000938# there are duplicated gene symbols for different ENSEMBL id
clusterProfiler::bitr(TCGA_LUAD_genes$ENSEMBL,
fromType = "ENSEMBL",
toType = "SYMBOL",
OrgDb = org.Hs.eg.db) %>%
janitor::get_dupes(SYMBOL) %>%
head()#> SYMBOL dupe_count ENSEMBL
#> 1 LOC124905422 16 ENSG00000199270
#> 2 LOC124905422 16 ENSG00000199334
#> 3 LOC124905422 16 ENSG00000199337
#> 4 LOC124905422 16 ENSG00000199352
#> 5 LOC124905422 16 ENSG00000199396
#> 6 LOC124905422 16 ENSG00000199910# just keep one of them (simple solution)
TCGA_LUAD_gene_map<- clusterProfiler::bitr(TCGA_LUAD_genes$ENSEMBL,
fromType = "ENSEMBL",
toType = "SYMBOL",
OrgDb = org.Hs.eg.db) %>%
distinct(SYMBOL, .keep_all = TRUE)
TCGA_LUAD_gene_map<- TCGA_LUAD_gene_map %>%
left_join(TCGA_LUAD_genes)
head(TCGA_LUAD_gene_map)#> ENSEMBL SYMBOL name value
#> 1 ENSG00000000003 TSPAN6 1 ENSG00000000003.15
#> 2 ENSG00000000005 TNMD 2 ENSG00000000005.6
#> 3 ENSG00000000419 DPM1 3 ENSG00000000419.13
#> 4 ENSG00000000457 SCYL3 4 ENSG00000000457.14
#> 5 ENSG00000000460 FIRRM 5 ENSG00000000460.17
#> 6 ENSG00000000938 FGR 6 ENSG00000000938.13Subset the gene expression matrices and replace the rownames to gene symbol.
TCGA_LUSC_mat<- TCGA_LUSC_mat[TCGA_LUAD_gene_map$value, ]
row.names(TCGA_LUSC_mat)<- TCGA_LUAD_gene_map$SYMBOL
TCGA_LUSC_mat[1:5, 1:5]
#> TCGA-43-7657-11A-01R-2125-07 TCGA-43-7657-01A-31R-2125-07
#> TSPAN6 2459 2329
#> TNMD 0 0
#> DPM1 1734 2533
#> SCYL3 795 496
#> FIRRM 206 434
#> TCGA-60-2695-01A-01R-0851-07 TCGA-21-1070-01A-01R-0692-07
#> TSPAN6 4271 2955
#> TNMD 1 0
#> DPM1 2692 2865
#> SCYL3 2494 887
#> FIRRM 2850 947
#> TCGA-94-7033-01A-11R-1949-07
#> TSPAN6 3405
#> TNMD 2
#> DPM1 1706
#> SCYL3 600
#> FIRRM 420TCGA_LUAD_mat<- TCGA_LUAD_mat[TCGA_LUAD_gene_map$value, ]
row.names(TCGA_LUAD_mat)<- TCGA_LUAD_gene_map$SYMBOL
TCGA_LUAD_mat[1:5, 1:5]#> TCGA-73-4658-01A-01R-1755-07 TCGA-44-2661-11A-01R-1758-07
#> TSPAN6 3659 1395
#> TNMD 188 8
#> DPM1 981 1031
#> SCYL3 456 541
#> FIRRM 158 135
#> TCGA-55-6986-11A-01R-1949-07 TCGA-55-8615-01A-11R-2403-07
#> TSPAN6 6760 2257
#> TNMD 3 0
#> DPM1 2070 644
#> SCYL3 1110 538
#> FIRRM 202 212
#> TCGA-97-8177-01A-11R-2287-07
#> TSPAN6 5009
#> TNMD 13
#> DPM1 2731
#> SCYL3 919
#> FIRRM 321## check the dimentions
dim(TCGA_LUSC_mat)#> [1] 36940 553dim(TCGA_LUAD_mat)#> [1] 36940 600combine TCGA LUSC and LUAD
PCA plot use top variable genes.
# double check the genes are the same
all.equal(rownames(TCGA_LUAD_mat), rownames(TCGA_LUSC_mat))
#> [1] TRUETCGA_lung_mat<- cbind(TCGA_LUSC_mat, TCGA_LUAD_mat)
TCGA_lung_meta<- data.frame(cancer_type = c(rep( "LUSC", ncol(TCGA_LUSC_mat)),
rep("LUAD", ncol(TCGA_LUAD_mat))))
rownames(TCGA_lung_meta)<- c(colnames(TCGA_LUAD_mat), colnames(TCGA_LUSC_mat))
head(TCGA_lung_meta)#> cancer_type
#> TCGA-73-4658-01A-01R-1755-07 LUSC
#> TCGA-44-2661-11A-01R-1758-07 LUSC
#> TCGA-55-6986-11A-01R-1949-07 LUSC
#> TCGA-55-8615-01A-11R-2403-07 LUSC
#> TCGA-97-8177-01A-11R-2287-07 LUSC
#> TCGA-49-6744-11A-01R-1858-07 LUSCdim(TCGA_lung_mat)#> [1] 36940 1153PCA after cpm (counts per million) normalization
library(ggplot2)
library(ggfortify)

# convert the raw counts to log2(cpm+1) using edgeR.
TCGA_lung_cpm<- edgeR::cpm(TCGA_lung_mat, log = TRUE, prior.count = 1)

select_top_var_genes<- function(mat, top_n=1000){
        idx<- order(rowVars(TCGA_lung_cpm), decreasing = TRUE)[1:top_n]
        return(mat[idx,])
}
## top 1000 most variable genes

TCGA_lung_cpm_sub <- select_top_var_genes(TCGA_lung_cpm, top_n = 1000)

TCGA_pca_res2 <- prcomp(t(TCGA_lung_cpm_sub), scale. = TRUE)

autoplot(TCGA_pca_res2, data = TCGA_lung_meta , color ="cancer_type") +
  scale_color_manual(values = c("blue", "red")) +
  ggtitle("TCGA NSCLC")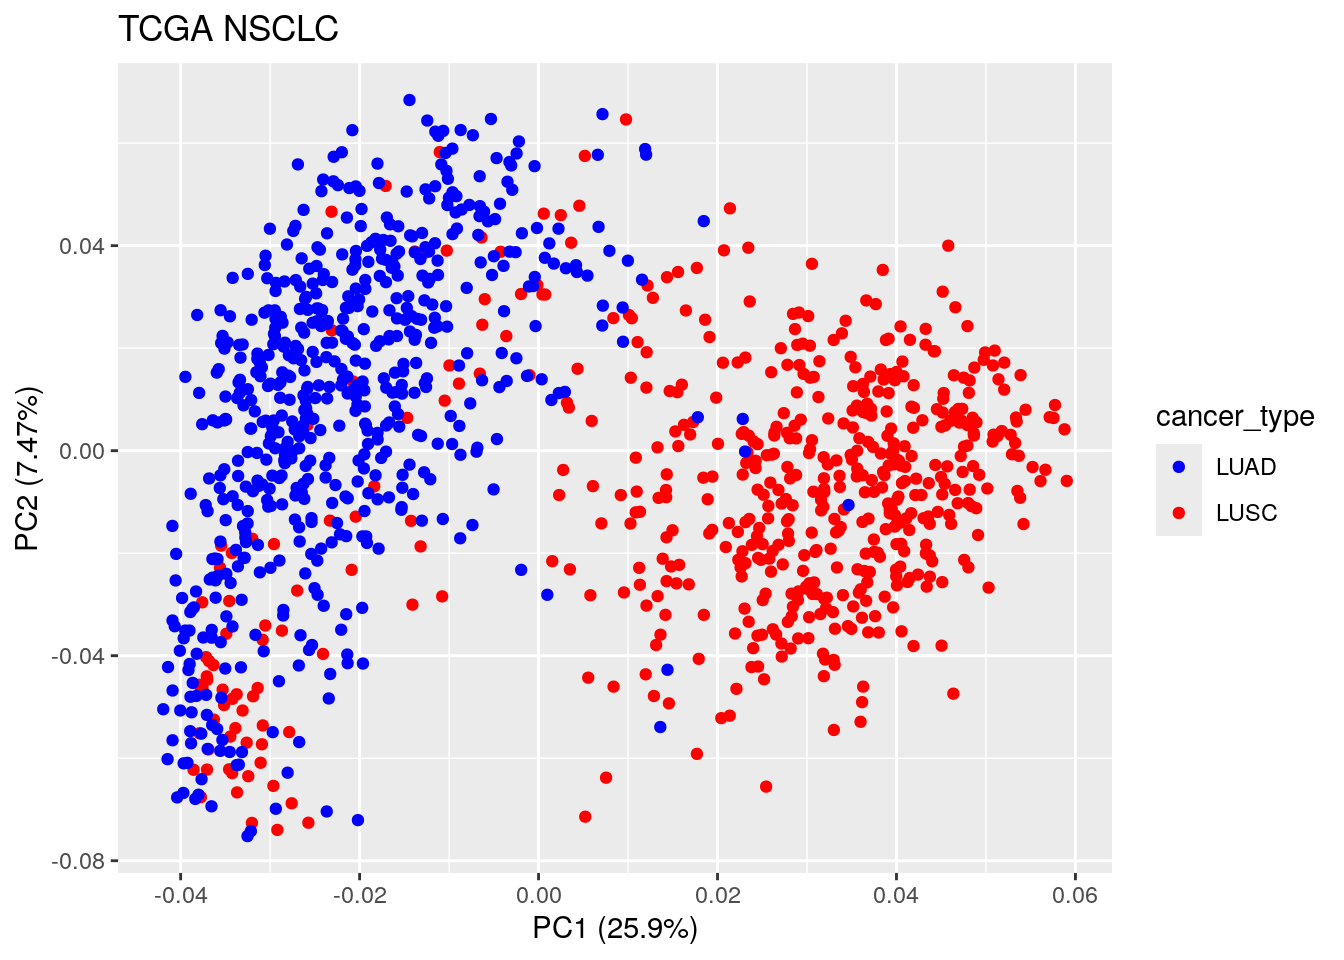
Now we see the first PC separates cancer type: LUSC vs LUAD, which makes sense! It is interesting to see some of the LUSC samples mix with the LUAD samples and vice versa.
Let’s further investigate those samples.
LUAD and LUSC markers
LUAD originates in the alveolar epithelial cells and is often associated with EGFR mutations, particularly in non-smokers.
NKX2-1 (TTF-1) Lung epithelial differentiation marker. Highly expressed in LUAD but absent in LUSC (TCGA, IHC studies).
NAPSA (Napsin A). Aspartic protease in surfactant protein processing. High specificity for LUAD (IHC studies).
TCGA_lung_meta$NAPSA<- TCGA_lung_cpm["NAPSA", ]
TCGA_lung_meta$TFF1<- TCGA_lung_cpm["TFF1", ]

autoplot(TCGA_pca_res2, data = TCGA_lung_meta , color ="TFF1") +
        scale_color_viridis_b() +
        facet_wrap(~ cancer_type) +
        ggtitle("TCGA NSCLC")
Let’s cap the TFF1 max value at 6
quantile(TCGA_lung_meta$TFF1, c(0.1,0.2,0.5,0.8,0.9, 0.951))#> 10% 20% 50% 80% 90% 95.1%
#> -5.660578 -4.480366 -2.351457 0.832825 3.428506 6.247145# Cap the maximum value at 6
TCGA_lung_meta$TFF1 <- pmin(TCGA_lung_meta$TFF1, 6)
autoplot(TCGA_pca_res2, data = TCGA_lung_meta , color ="TFF1") +
scale_color_viridis_b() +
facet_wrap(~ cancer_type) +
ggtitle("TCGA NSCLC")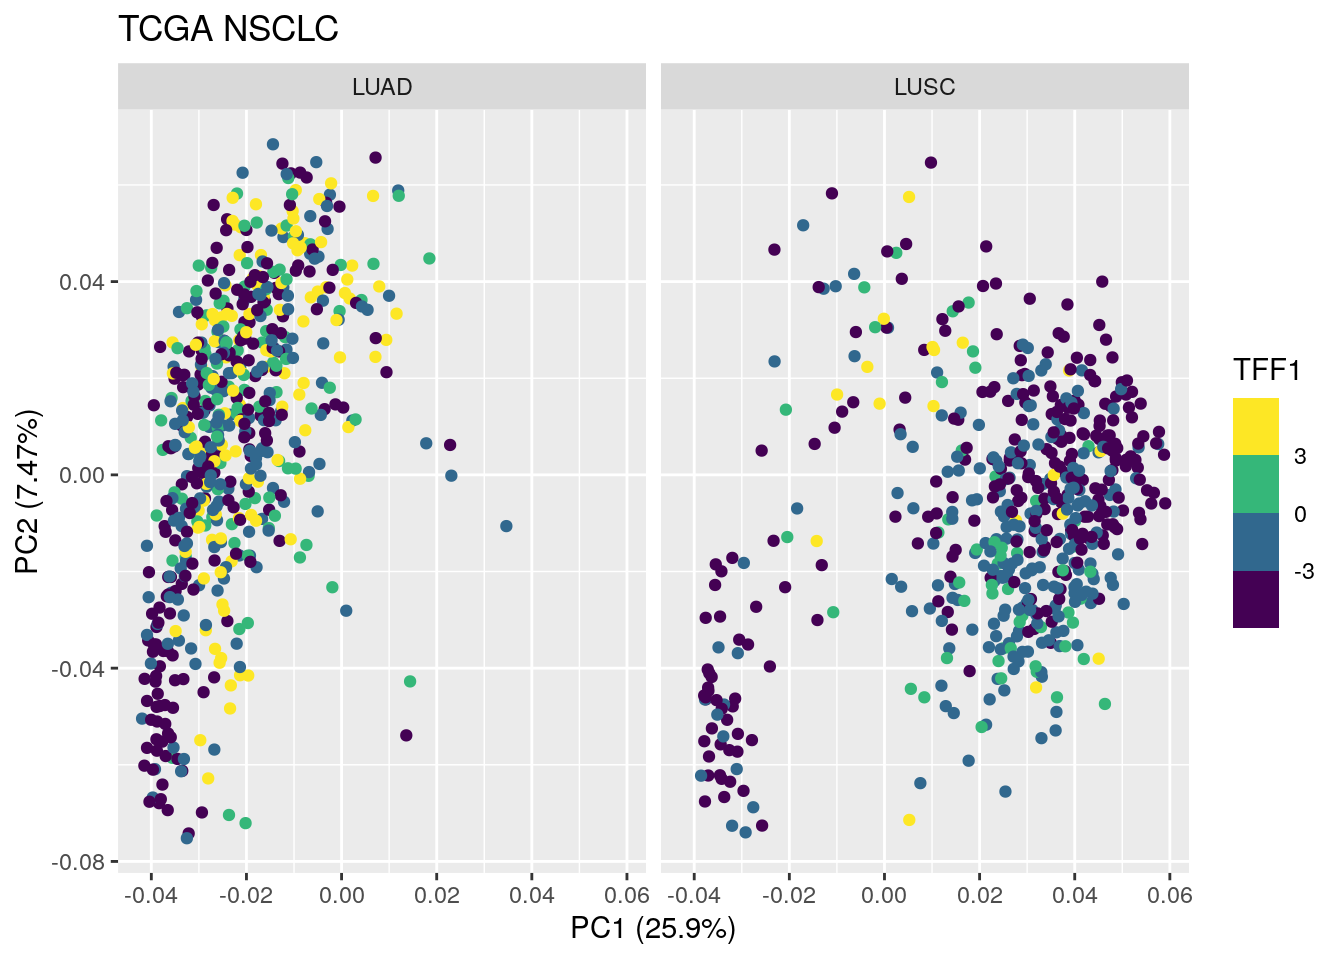 TFF1 mRNA is not high across the LUAD samples. TFF1 protein maybe a better marker?
quantile(TCGA_lung_meta$NAPSA, c(0.1,0.2,0.5,0.8,0.9, 0.951))#> 10% 20% 50% 80% 90% 95.1%
#> 0.5522465 3.3168667 7.5590742 9.9427697 10.4473737 10.9337256# Cap the maximum value at 8
TCGA_lung_meta$NAPSA <- pmin(TCGA_lung_meta$NAPSA, 8)
autoplot(TCGA_pca_res2, data = TCGA_lung_meta , color ="NAPSA") +
scale_color_viridis_b() +
facet_wrap(~ cancer_type) +
ggtitle("TCGA NSCLC")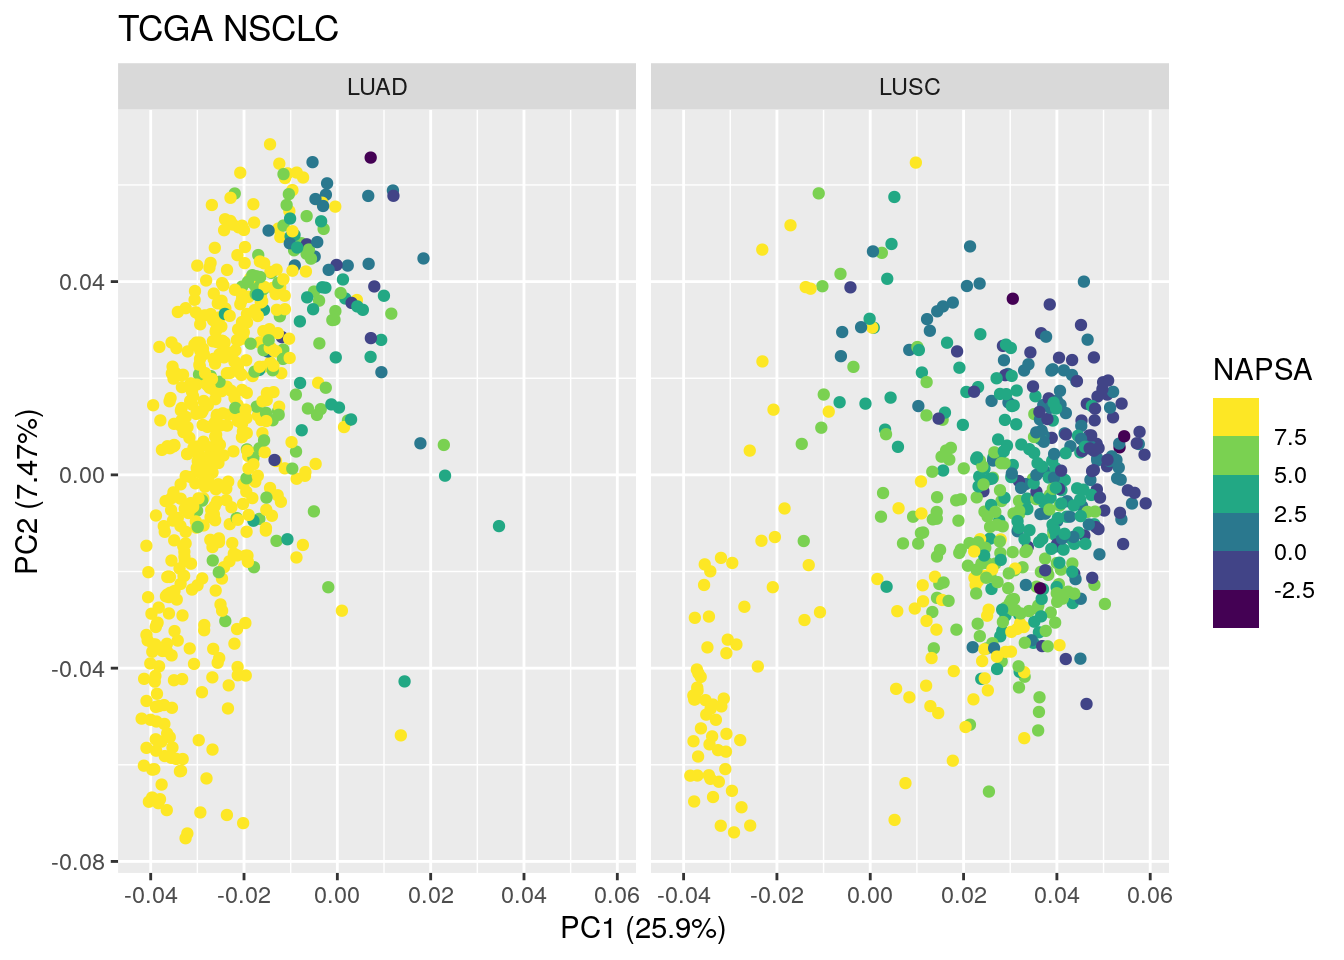
NAPSA level looks pretty high in most of the LUAD samples. The LUAD samples at PC1 > 0 have lower NAPSA levels. Also, the LUSC samples at PC1 < 0 have high NAPSA levels too.
Are those samples mislabeled?
Let’s check several LUSC markers.
LUSC arises from the bronchial epithelium and is strongly associated with smoking.
TP63 (ΔNp63).
Transcription factor crucial for squamous differentiation.
High expression in LUSC, absent in LUAD (TCGA, IHC studies).
KRT5 (Cytokeratin 5).
Cytoskeletal protein in basal epithelial cells.
Expressed in LUSC, absent in LUAD.
TCGA_lung_meta$TP63<- TCGA_lung_cpm["TP63", ]
TCGA_lung_meta$KRT5<- TCGA_lung_cpm["KRT5", ]

TCGA_lung_meta$TP63 <- pmin(TCGA_lung_meta$TP63, 8)
autoplot(TCGA_pca_res2, data = TCGA_lung_meta , color ="TP63") +
        scale_color_viridis_b() +
        facet_wrap(~ cancer_type) +
ggtitle("TCGA NSCLC") 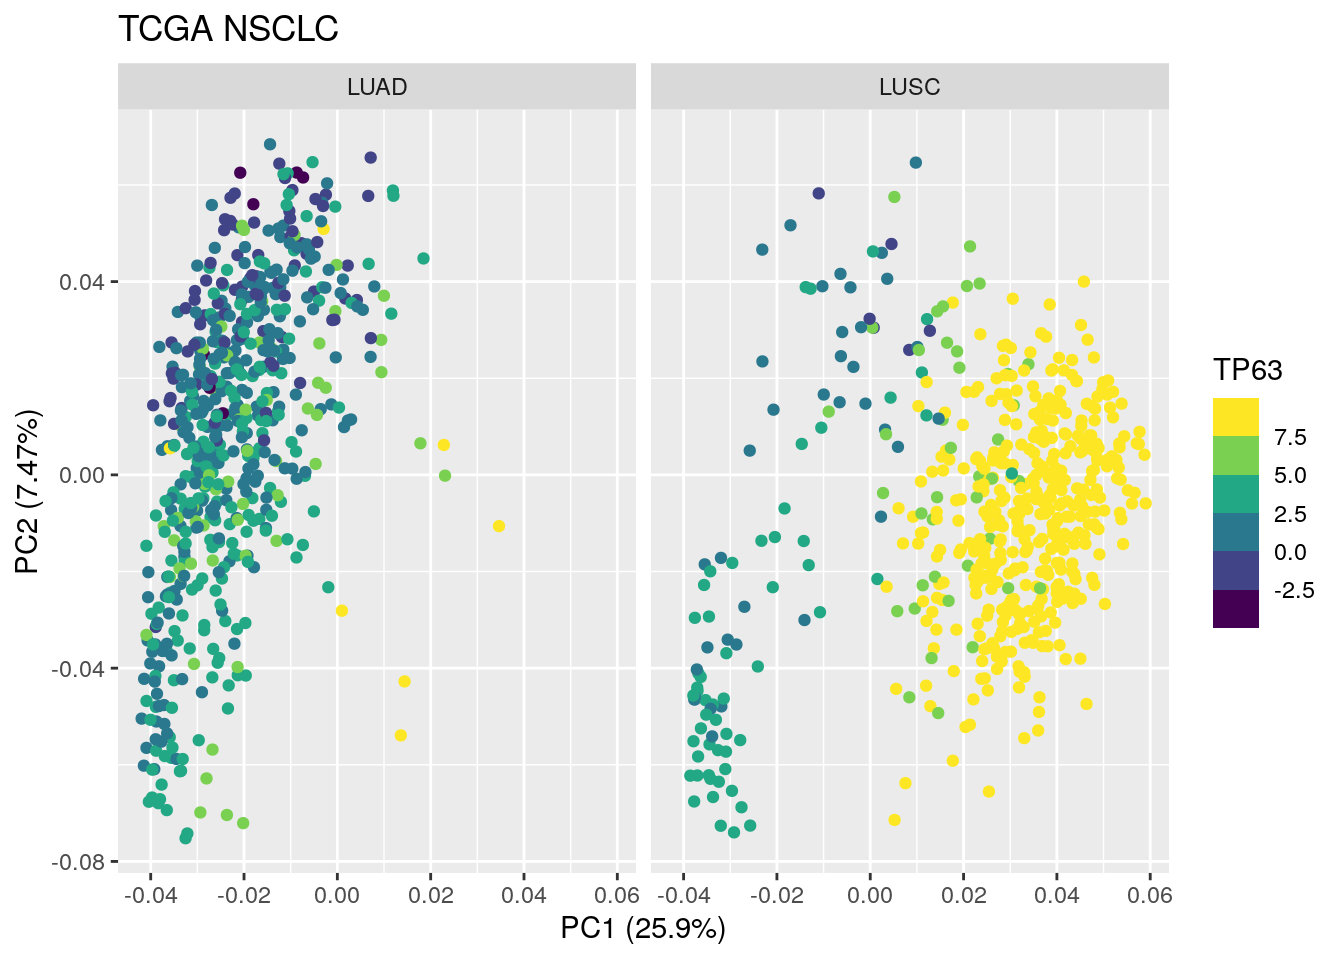
autoplot(TCGA_pca_res2, data = TCGA_lung_meta , color ="KRT5") +
scale_color_viridis_b() +
facet_wrap(~ cancer_type) +
ggtitle("TCGA NSCLC")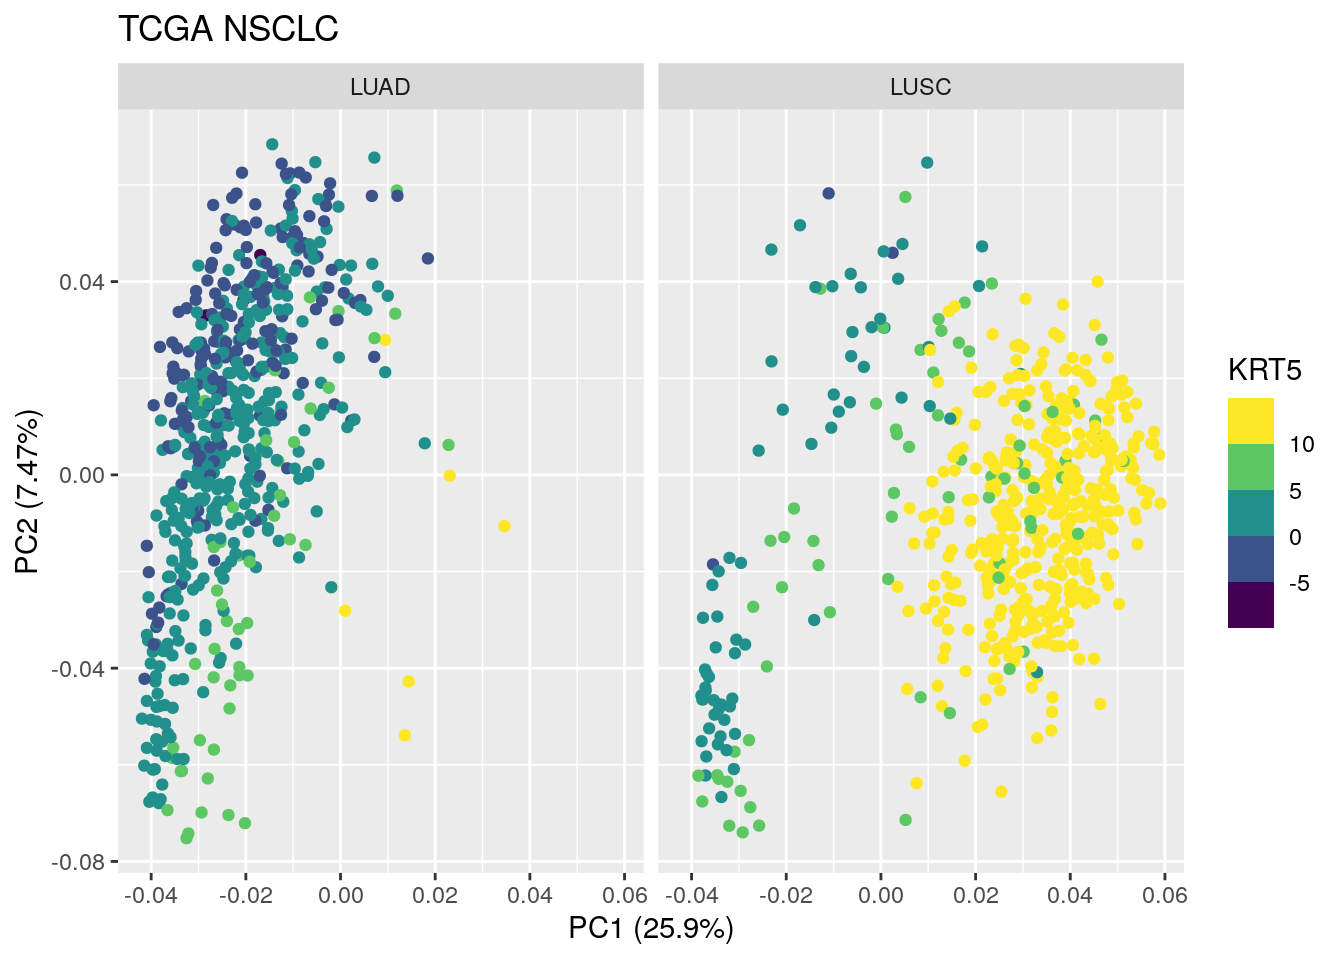 Both TP63 and KRT5 are very high in most of the LUSC samples except the samples that are located in PC1 < 0.
Isolate those samples based on PC1
PC1_greater_zero<- TCGA_pca_res2$x[, 1] > 0

PC1_smaller_zero<- TCGA_pca_res2$x[, 1] < 0

TCGA_lung_meta$PC1_greater_zero<- PC1_greater_zero
TCGA_lung_meta$PC1_smaller_zero<- PC1_smaller_zero

head(TCGA_lung_meta)
#> cancer_type NAPSA TFF1 TP63
#> TCGA-73-4658-01A-01R-1755-07 LUSC 8.000000 -4.324249 3.9402703
#> TCGA-44-2661-11A-01R-1758-07 LUSC -1.606127 -4.303566 8.0000000
#> TCGA-55-6986-11A-01R-1949-07 LUSC 6.353927 -3.275591 0.2082599
#> TCGA-55-8615-01A-11R-2403-07 LUSC 5.488879 -5.660578 8.0000000
#> TCGA-97-8177-01A-11R-2287-07 LUSC 5.493101 -1.190246 7.3304868
#> TCGA-49-6744-11A-01R-1858-07 LUSC 7.820269 -2.755688 7.9849378
#> KRT5 PC1_greater_zero PC1_smaller_zero
#> TCGA-73-4658-01A-01R-1755-07 5.319164 FALSE TRUE
#> TCGA-44-2661-11A-01R-1758-07 12.662280 TRUE FALSE
#> TCGA-55-6986-11A-01R-1949-07 9.679160 TRUE FALSE
#> TCGA-55-8615-01A-11R-2403-07 12.642629 TRUE FALSE
#> TCGA-97-8177-01A-11R-2287-07 13.268546 TRUE FALSE
#> TCGA-49-6744-11A-01R-1858-07 12.970187 TRUE FALSE### samples that are labeled as LUAD but mixed with LUSC
TCGA_lung_meta %>%
filter(cancer_type == "LUAD", PC1_greater_zero)#> cancer_type NAPSA TFF1 TP63
#> TCGA-86-8673-01A-11R-2403-07 LUAD 4.5663310 -2.9086627 8.00000000
#> TCGA-62-A46V-01A-11R-A24H-07 LUAD 8.0000000 -3.9525629 8.00000000
#> TCGA-50-5044-01A-21R-1858-07 LUAD 5.1896518 6.0000000 4.97915437
#> TCGA-68-7757-01B-11R-2296-07 LUAD 5.2821693 -2.6573753 2.13422809
#> TCGA-85-A510-01A-11R-A26W-07 LUAD 0.6750456 0.8804522 3.06914674
#> TCGA-46-3766-01A-01R-0980-07 LUAD 3.8035608 1.2287754 8.00000000
#> TCGA-22-5481-11A-01R-1949-07 LUAD 1.6385518 2.6653434 3.75590039
#> TCGA-22-5478-11A-11R-1635-07 LUAD 0.8663622 -2.4048553 6.74546294
#> TCGA-85-7696-01A-11R-2125-07 LUAD 4.2119379 -5.6605785 4.22054191
#> TCGA-22-4594-01A-01R-1201-07 LUAD 8.0000000 2.2538799 -0.25637501
#> TCGA-6A-AB49-01A-12R-A405-07 LUAD 3.3164053 6.0000000 -0.36926332
#> TCGA-56-7582-11A-01R-2045-07 LUAD 4.7683084 4.7304238 7.43781179
#> TCGA-56-8305-01A-11R-2296-07 LUAD 2.4551189 -3.2311191 6.68722426
#> TCGA-56-8082-11A-01R-2247-07 LUAD -1.0005648 -5.6605785 3.04340846
#> TCGA-46-3768-01A-01R-0980-07 LUAD 3.4054552 -1.5515290 0.01880819
#> TCGA-51-6867-01A-11R-2045-07 LUAD -0.1692585 -3.7407587 -0.22384634
#> TCGA-18-5592-01A-01R-1635-07 LUAD 7.6273065 4.3000062 1.39552859
#> TCGA-37-A5EN-01A-21R-A26W-07 LUAD 4.4655326 -2.5591610 7.30258763
#> TCGA-33-4566-01A-01R-1443-07 LUAD 3.6139878 -1.5412537 0.67660915
#> TCGA-37-3783-01A-01R-1201-07 LUAD 0.4009309 -0.6624330 3.43389639
#> TCGA-63-6202-01A-11R-1820-07 LUAD 2.6775120 -1.4593075 7.44113586
#> TCGA-85-A4PA-01A-11R-A24Z-07 LUAD -0.8290303 5.1433581 2.46188014
#> TCGA-34-2596-01A-01R-0851-07 LUAD 5.0267500 -4.0101523 7.61493110
#> TCGA-85-8351-01A-11R-2296-07 LUAD 3.5228858 2.0954799 0.82487449
#> TCGA-22-5479-01A-31R-1949-07 LUAD 3.5100065 4.0738093 1.32455573
#> TCGA-NK-A5CX-01A-11R-A26W-07 LUAD 6.0066781 3.8234108 2.41929047
#> TCGA-NC-A5HQ-01A-11R-A26W-07 LUAD 7.9814798 -0.5346360 7.74020469
#> TCGA-85-7699-01A-11R-2125-07 LUAD 4.8822744 3.2524249 0.83695151
#> TCGA-22-4604-01A-01R-1201-07 LUAD 2.2691027 6.0000000 -1.44367696
#> TCGA-34-5234-01A-01R-1635-07 LUAD -4.5754090 -5.6605785 -1.69885139
#> TCGA-58-8392-01A-11R-2326-07 LUAD -1.1835498 2.4616245 2.52401659
#> TCGA-63-A5MV-01A-21R-A26W-07 LUAD 1.4774444 3.7063909 -0.04737659
#> KRT5 PC1_greater_zero PC1_smaller_zero
#> TCGA-86-8673-01A-11R-2403-07 13.2356777 TRUE FALSE
#> TCGA-62-A46V-01A-11R-A24H-07 11.0546842 TRUE FALSE
#> TCGA-50-5044-01A-21R-1858-07 8.6900116 TRUE FALSE
#> TCGA-68-7757-01B-11R-2296-07 -1.6421941 TRUE FALSE
#> TCGA-85-A510-01A-11R-A26W-07 -0.7983457 TRUE FALSE
#> TCGA-46-3766-01A-01R-0980-07 12.3189714 TRUE FALSE
#> TCGA-22-5481-11A-01R-1949-07 0.9659658 TRUE FALSE
#> TCGA-22-5478-11A-11R-1635-07 4.9274942 TRUE FALSE
#> TCGA-85-7696-01A-11R-2125-07 0.1741246 TRUE FALSE
#> TCGA-22-4594-01A-01R-1201-07 -1.1152292 TRUE FALSE
#> TCGA-6A-AB49-01A-12R-A405-07 0.5338189 TRUE FALSE
#> TCGA-56-7582-11A-01R-2045-07 11.0139166 TRUE FALSE
#> TCGA-56-8305-01A-11R-2296-07 4.3536074 TRUE FALSE
#> TCGA-56-8082-11A-01R-2247-07 -1.2340165 TRUE FALSE
#> TCGA-46-3768-01A-01R-0980-07 2.8018288 TRUE FALSE
#> TCGA-51-6867-01A-11R-2045-07 5.7568558 TRUE FALSE
#> TCGA-18-5592-01A-01R-1635-07 2.0926904 TRUE FALSE
#> TCGA-37-A5EN-01A-21R-A26W-07 2.4172140 TRUE FALSE
#> TCGA-33-4566-01A-01R-1443-07 0.6207392 TRUE FALSE
#> TCGA-37-3783-01A-01R-1201-07 7.6497640 TRUE FALSE
#> TCGA-63-6202-01A-11R-1820-07 11.1047418 TRUE FALSE
#> TCGA-85-A4PA-01A-11R-A24Z-07 4.5905074 TRUE FALSE
#> TCGA-34-2596-01A-01R-0851-07 9.2787683 TRUE FALSE
#> TCGA-85-8351-01A-11R-2296-07 3.2194062 TRUE FALSE
#> TCGA-22-5479-01A-31R-1949-07 -1.4336687 TRUE FALSE
#> TCGA-NK-A5CX-01A-11R-A26W-07 -0.5332040 TRUE FALSE
#> TCGA-NC-A5HQ-01A-11R-A26W-07 10.9722815 TRUE FALSE
#> TCGA-85-7699-01A-11R-2125-07 1.8870867 TRUE FALSE
#> TCGA-22-4604-01A-01R-1201-07 0.7859955 TRUE FALSE
#> TCGA-34-5234-01A-01R-1635-07 2.1115393 TRUE FALSE
#> TCGA-58-8392-01A-11R-2326-07 -3.2069578 TRUE FALSE
#> TCGA-63-A5MV-01A-21R-A26W-07 -1.2697271 TRUE FALSEOne can further investigate those samples (by imaging data or proteomics data) and see if there could be mislabeled.
### samples that are labeled as LUSC but mixed with LUAD
TCGA_lung_meta %>%
        filter(cancer_type == "LUSC", PC1_smaller_zero) %>%
        head()
#> cancer_type NAPSA TFF1 TP63 KRT5
#> TCGA-73-4658-01A-01R-1755-07 LUSC 8.00000 -4.324249 3.940270 5.319164
#> TCGA-67-3771-01A-01R-0946-07 LUSC 8.00000 -3.701993 4.260983 7.132368
#> TCGA-44-6776-11A-01R-1858-07 LUSC 8.00000 -5.660578 3.632858 6.775651
#> TCGA-55-8511-01A-11R-2403-07 LUSC 7.89183 -3.911218 5.754526 3.194861
#> TCGA-97-8172-01A-11R-2287-07 LUSC 8.00000 -4.485356 1.690959 1.436336
#> TCGA-55-6979-01A-11R-1949-07 LUSC 6.51150 -3.224689 4.954470 2.687894
#> PC1_greater_zero PC1_smaller_zero
#> TCGA-73-4658-01A-01R-1755-07 FALSE TRUE
#> TCGA-67-3771-01A-01R-0946-07 FALSE TRUE
#> TCGA-44-6776-11A-01R-1858-07 FALSE TRUE
#> TCGA-55-8511-01A-11R-2403-07 FALSE TRUE
#> TCGA-97-8172-01A-11R-2287-07 FALSE TRUE
#> TCGA-55-6979-01A-11R-1949-07 FALSE TRUEPCA on the rank matrix
There could be certain batch effect that we do not know.
and the batch effect somehow force the LUAD and LUSC mixing in the PCA plot.
Let’s try rank the genes per sample by their expression level and use the rank matrix to do PCA.
# Convert to rank matrix (ranking each column separately)
# TPM may be better than CPM
# rank_matrix <- apply(TCGA_lung_cpm, 2, rank, ties.method = "average")
# faster than the apply

library(matrixStats)
rank_matrix <- colRanks(TCGA_lung_cpm, ties.method = "average")

## colRanks returns sample x gene, transpose it back to gene x sample
rank_matrix<- t(rank_matrix)

hist(rank_matrix)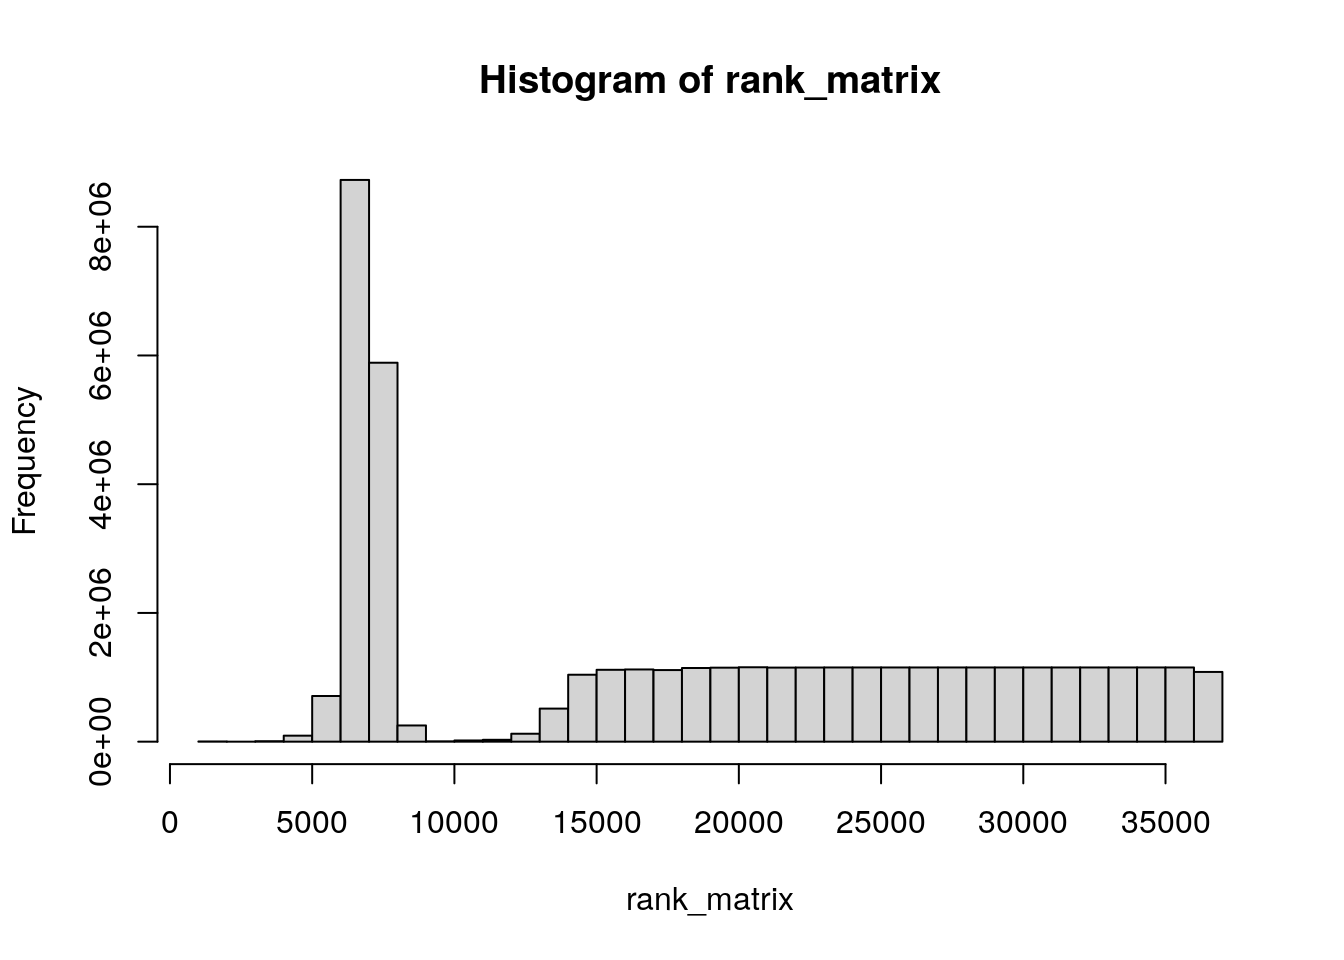
PCA assumes continuous, approximately normal data because it relies on variance computation. Rank values are discrete and not normally distributed. However, in practice, PCA can still work on ranked data, though its interpretation changes.
rank_matrix_sub<- select_top_var_genes(rank_matrix, top_n = 1000)
hist(rank_matrix_sub)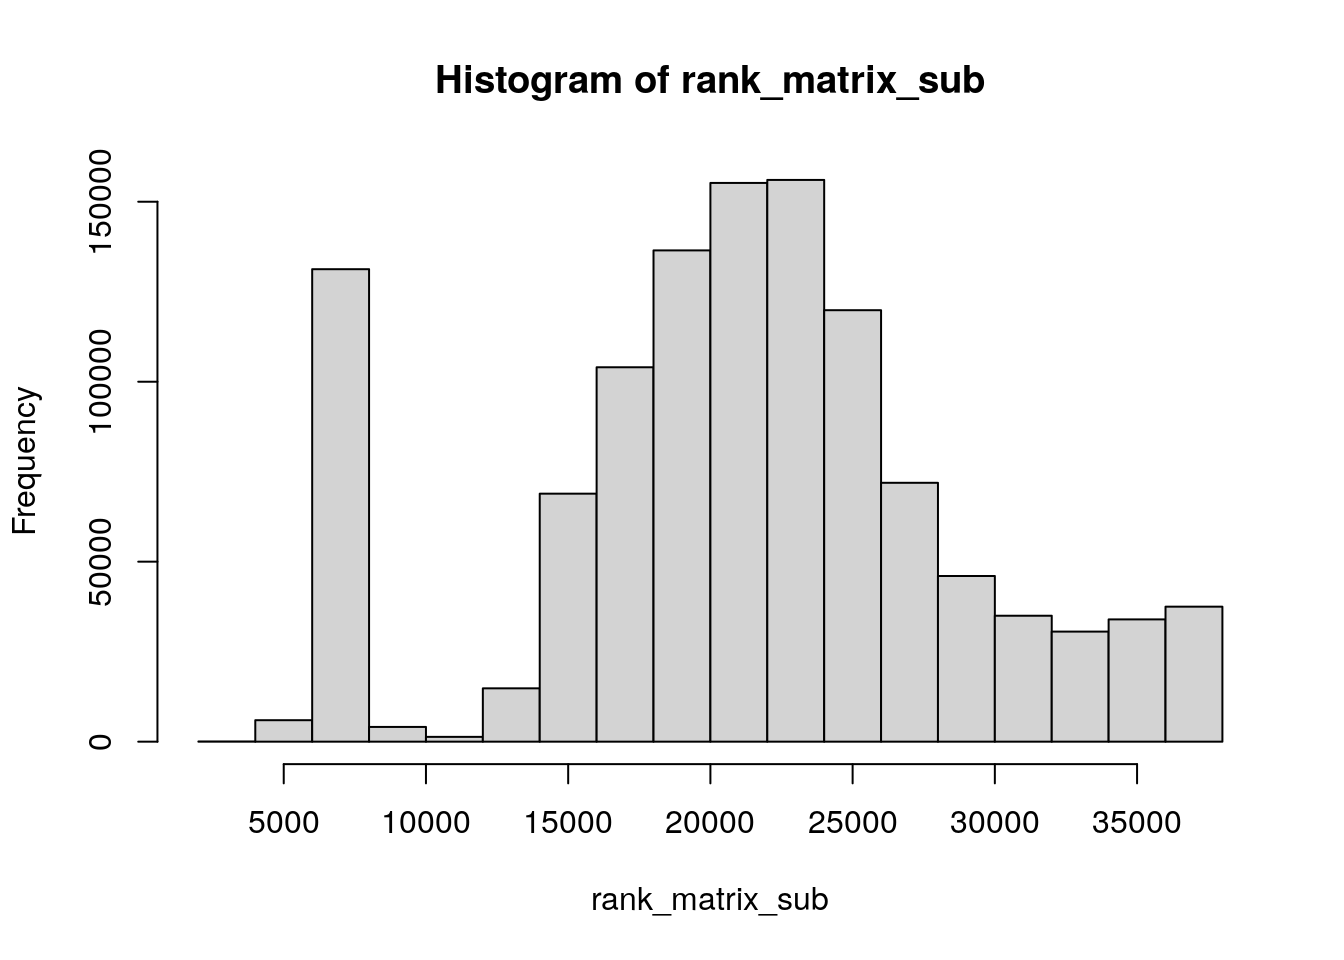 It looks approximately normal.
PCA on this matrix:
pca_result_rank<- prcomp(t(rank_matrix_sub), scale. = TRUE)

autoplot(pca_result_rank, data = TCGA_lung_meta , color ="cancer_type") +
  ggtitle("TCGA NSCLC raw rank")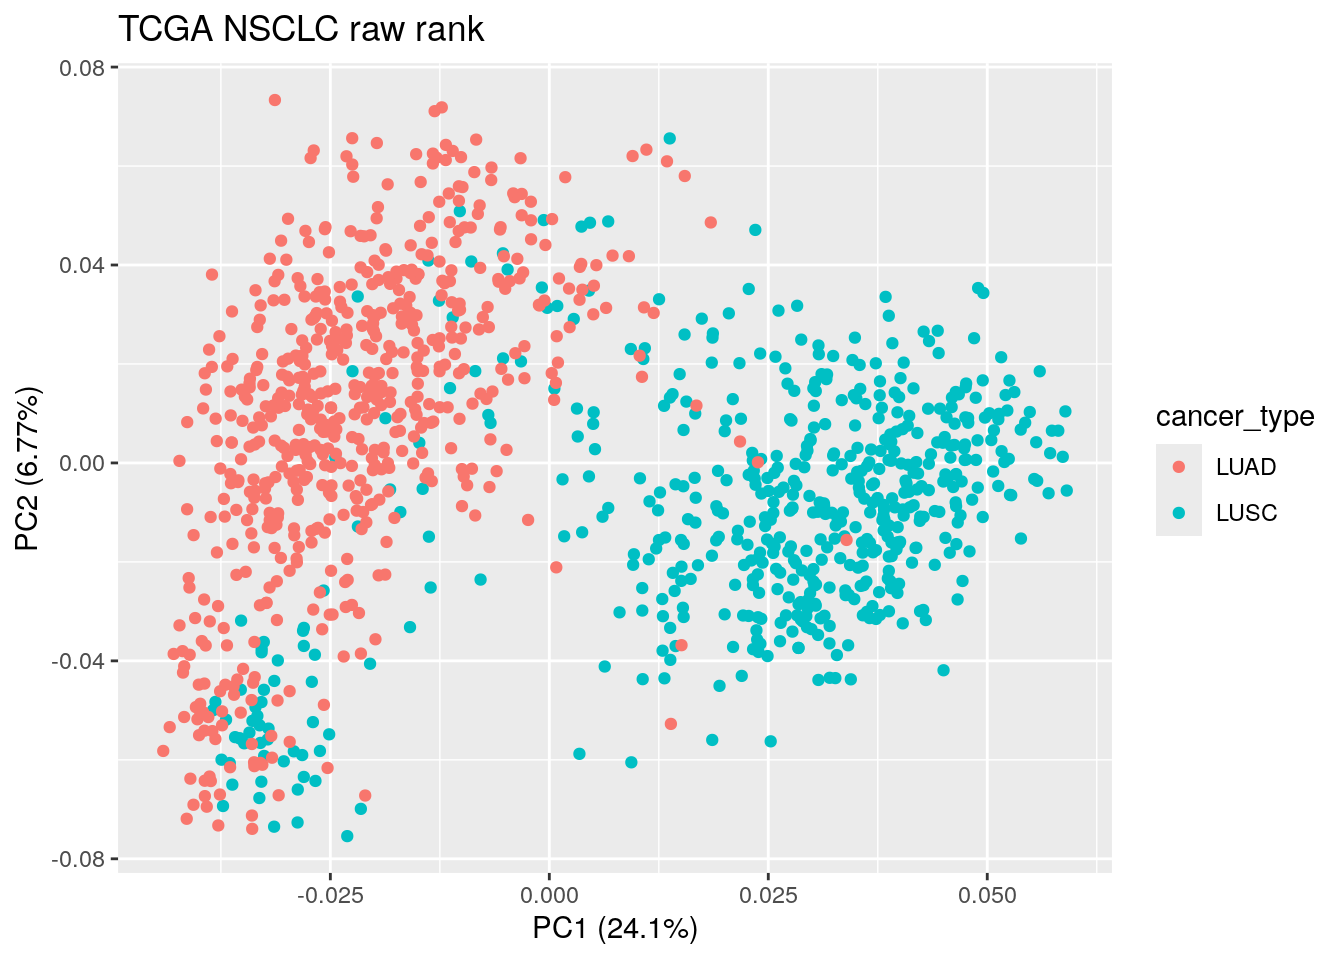
autoplot(pca_result_rank, data = TCGA_lung_meta , color ="cancer_type") +
facet_wrap(~cancer_type) +
ggtitle("TCGA NSCLC raw rank")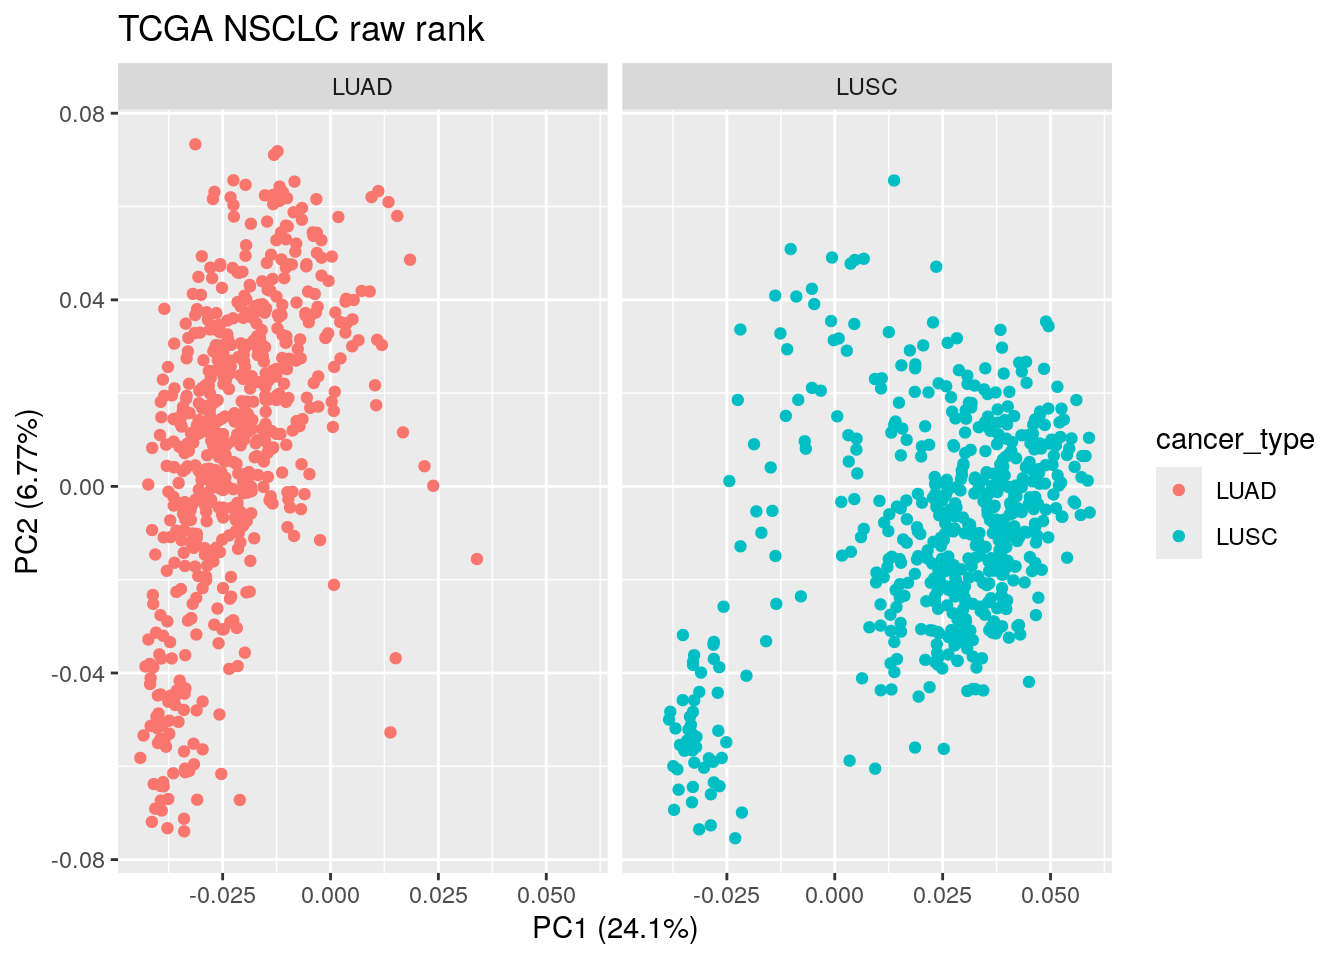 PCA on the raw rank matrix somehow can separate LUAD and LUSC as well!
PCA on normalized rank matrix
This maps ranks to a normal distribution using the inverse normal transformation.
rank_normalized<- qnorm((rank_matrix - 0.5) / nrow(rank_matrix))
hist(rank_normalized)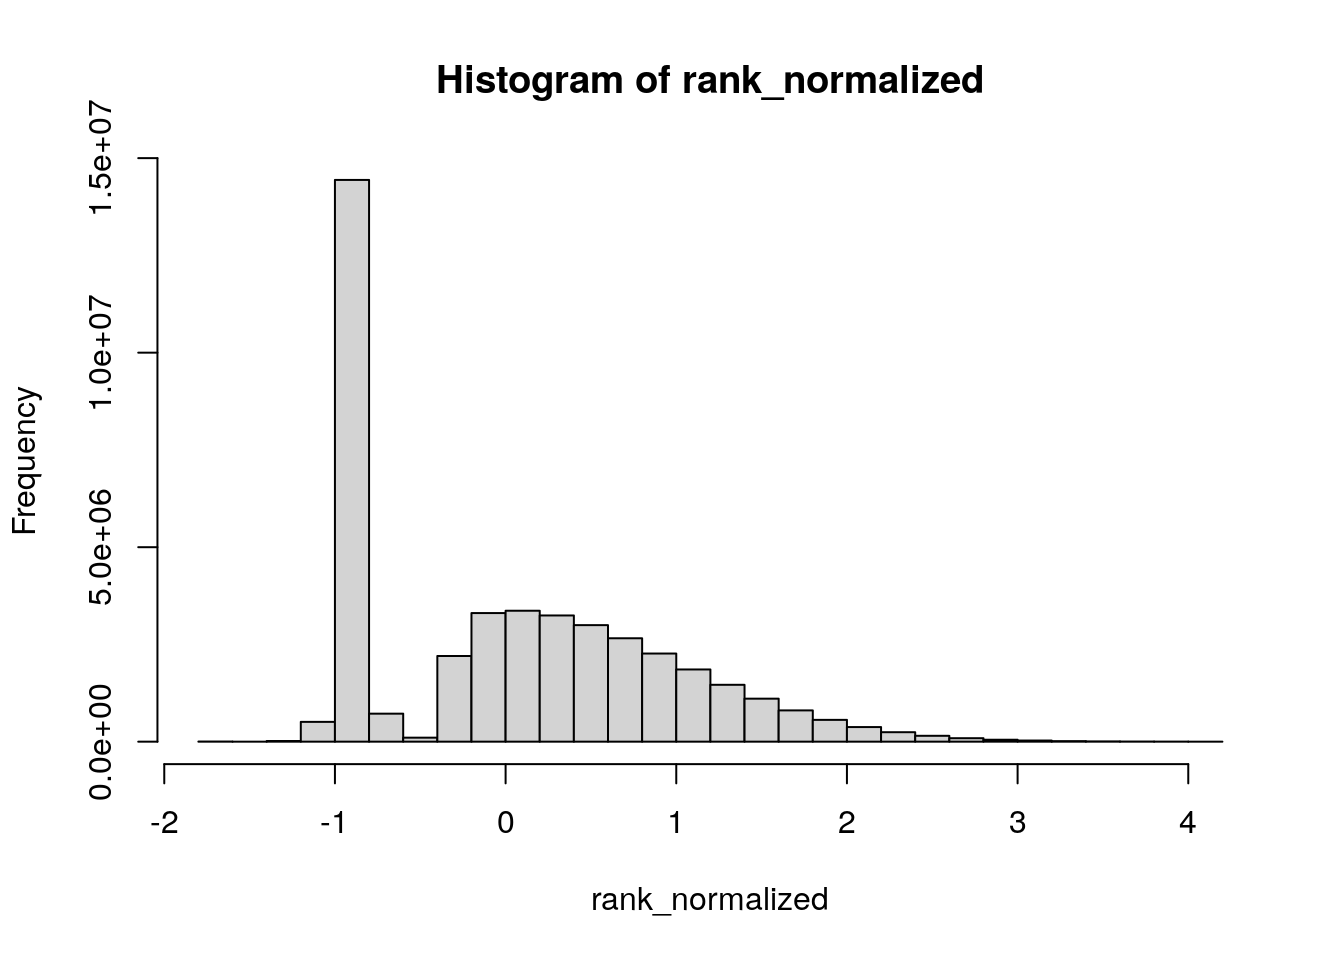
rank_normalized_sub<- select_top_var_genes(rank_normalized, top_n = 1000)
hist(rank_normalized_sub)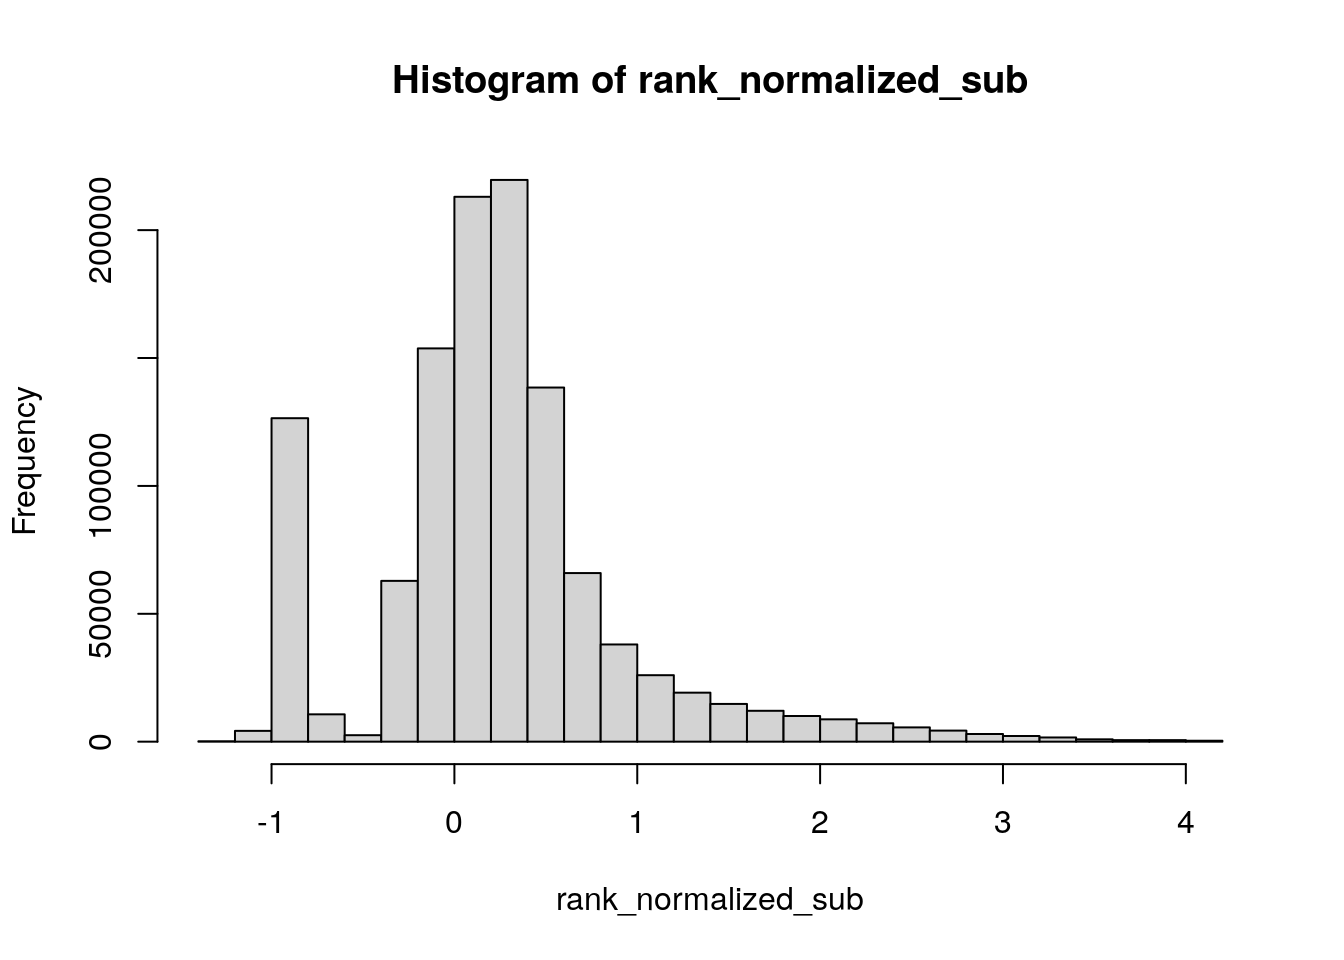 It looks approximately normal.
PCA on the normalized rank matrix
pca_result_rank<- prcomp(t(rank_normalized_sub), scale. = TRUE)

autoplot(pca_result_rank, data = TCGA_lung_meta , color ="cancer_type") +
  ggtitle("TCGA NSCLC normalized rank")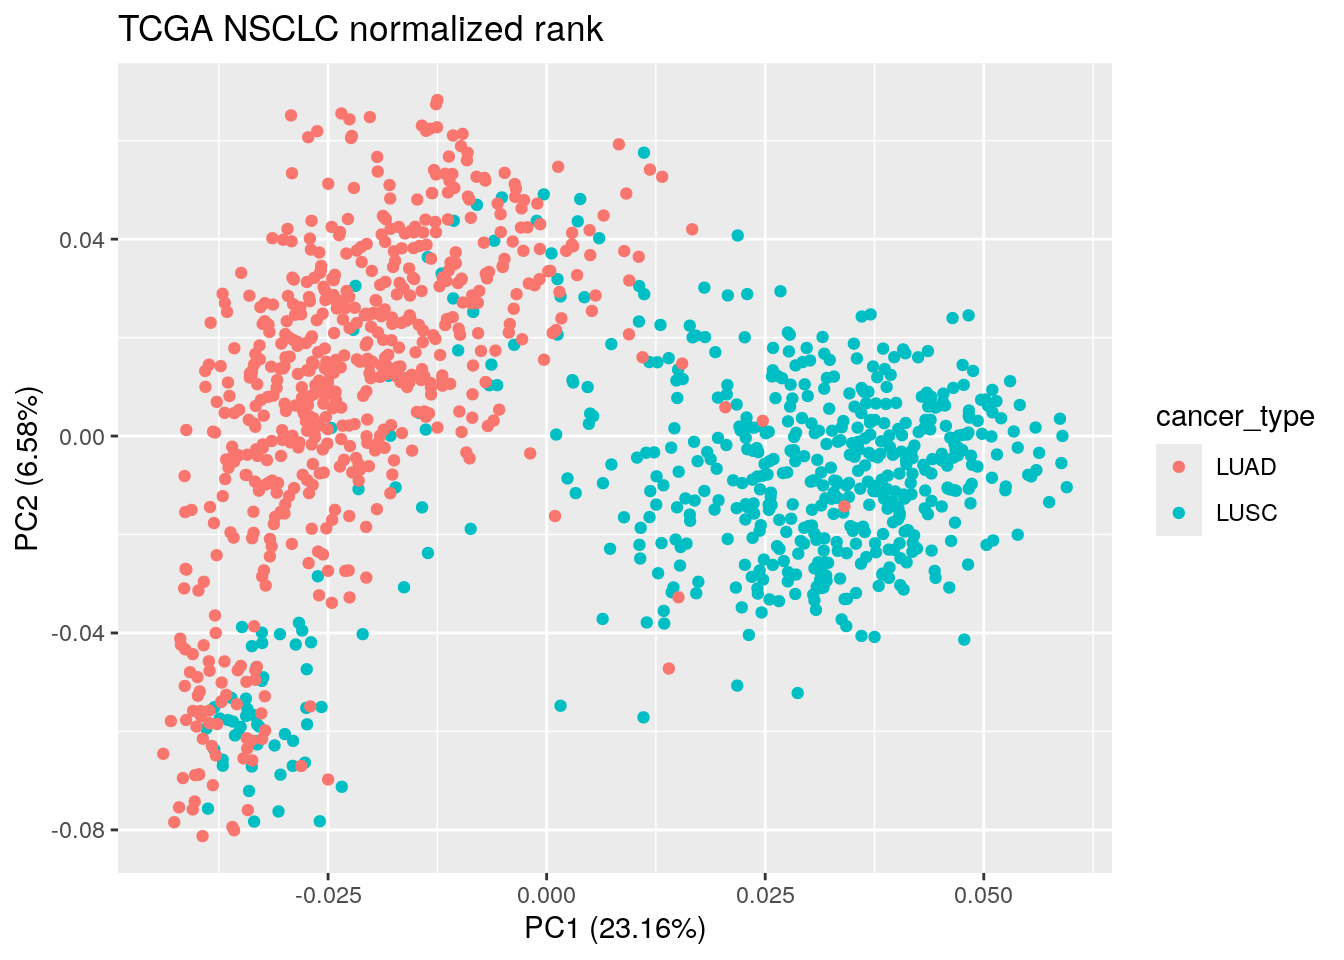
autoplot(pca_result_rank, data = TCGA_lung_meta , color ="cancer_type") +
  facet_wrap(~cancer_type) +
  ggtitle("TCGA NSCLC normalized rank")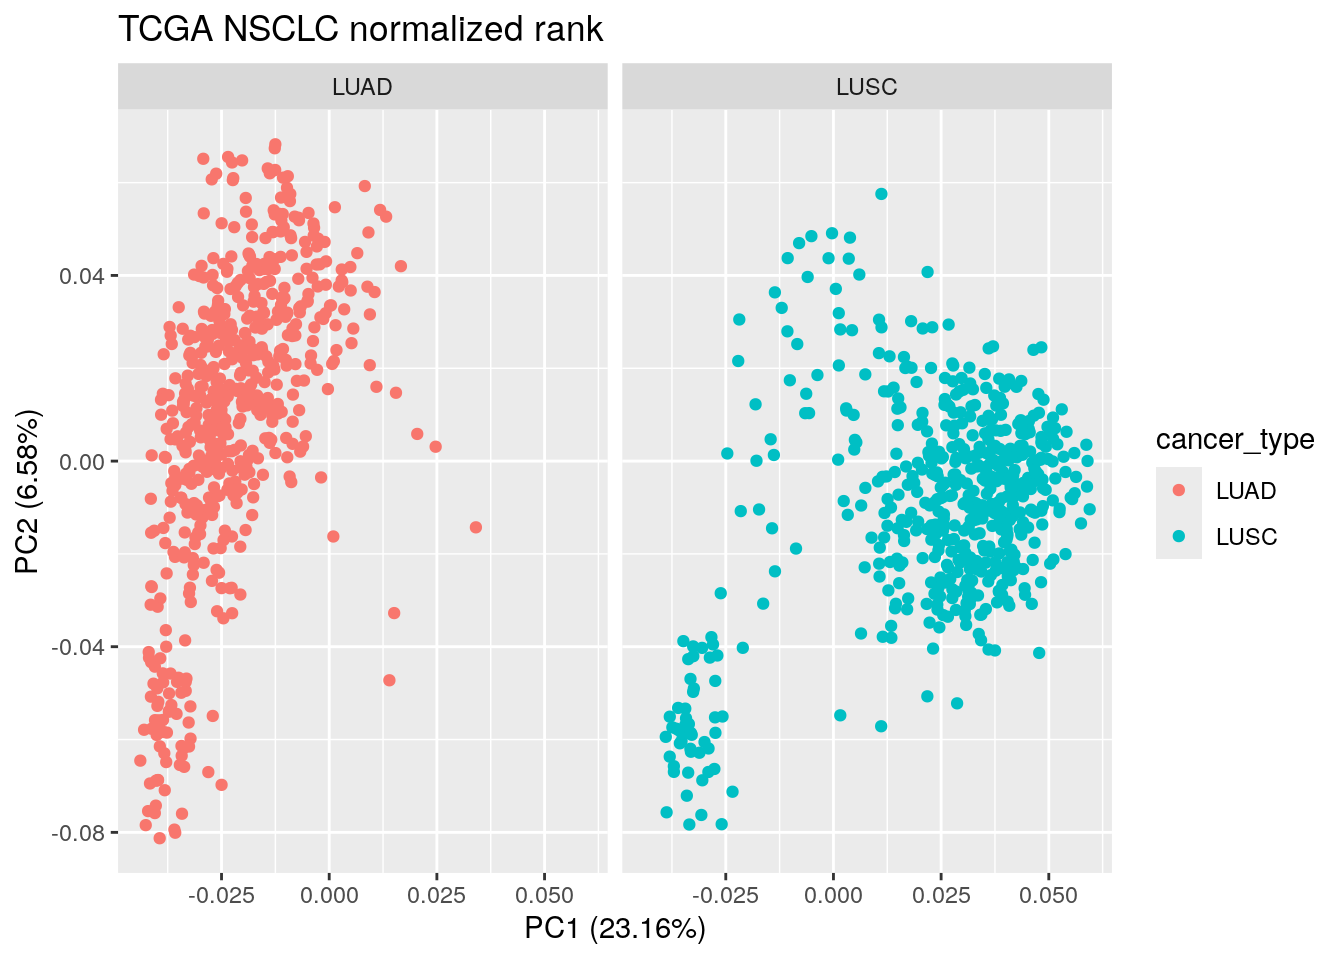
The PCA plot looks similar to the one with the raw rank and the cpm normalized counts. We still see those LUAD/LUSC mixing samples.
Key takeaways
Use PCA do do exploratory data analysis.
Use your biology knowledge (in our case, LUAD and LUSC known markers) to investigate the strange samples.
PCA on the raw rank matrix and the normalized rank matrix can separate the LUAD and LUSC samples.
There is a long post for how to use DESeq2 on large scale dataset.
https://bsky.app/profile/iansudbery.bsky.social/post/3lgdp62x5bc2q
In my next blog post, I will show you using DESeq2 vs wilcox rank sum test for
differential gene expression analysis.
Further reading
Removing unwanted variation from large-scale RNA sequencing data with PRPS
The github repo associated with the paper has a lot of tutorials https://github.com/RMolania/TCGA_PanCancer_UnwantedVariation/
Twitter thread by Mike Love on how to analyze large scale RNAseq data https://x.com/mikelove/status/1513468597288452097?s=46
Follow Mike Love’s tutorial here https://github.com/mikelove/preNivolumabOnNivolumab