reorder factors for boxplot
It is very common that you want to reorder the boxplot according to the medians to see a better trend. I will show you how to do it using ggplot2 and the forcats packages which are developed by Hadely Wickham.
Read his new R for data science book: http://r4ds.had.co.nz/factors.html
head(iris)
Sepal.Length |
Sepal.Width |
Petal.Length |
Petal.Width |
Species |
|
|---|---|---|---|---|---|
| 1 | 5.1 | 3.5 | 1.4 | 0.2 | setosa |
| 2 | 4.9 | 3.0 | 1.4 | 0.2 | setosa |
| 3 | 4.7 | 3.2 | 1.3 | 0.2 | setosa |
| 4 | 4.6 | 3.1 | 1.5 | 0.2 | setosa |
| 5 | 5.0 | 3.6 | 1.4 | 0.2 | setosa |
| 6 | 5.4 | 3.9 | 1.7 | 0.4 | setosa |
6 rows
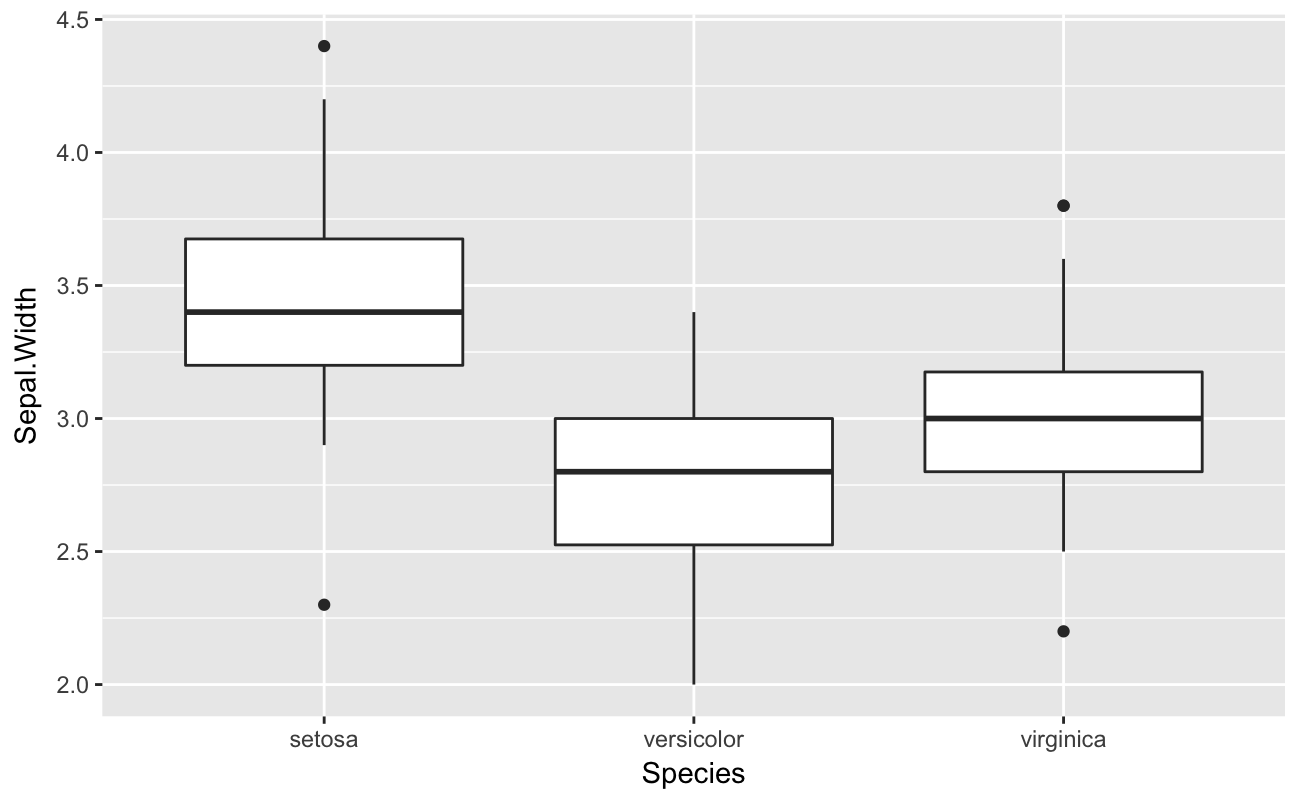
a basic boxplot:
library(ggplot2)
ggplot(iris, aes(x = Species, y = Sepal.Width)) + geom_boxplot()
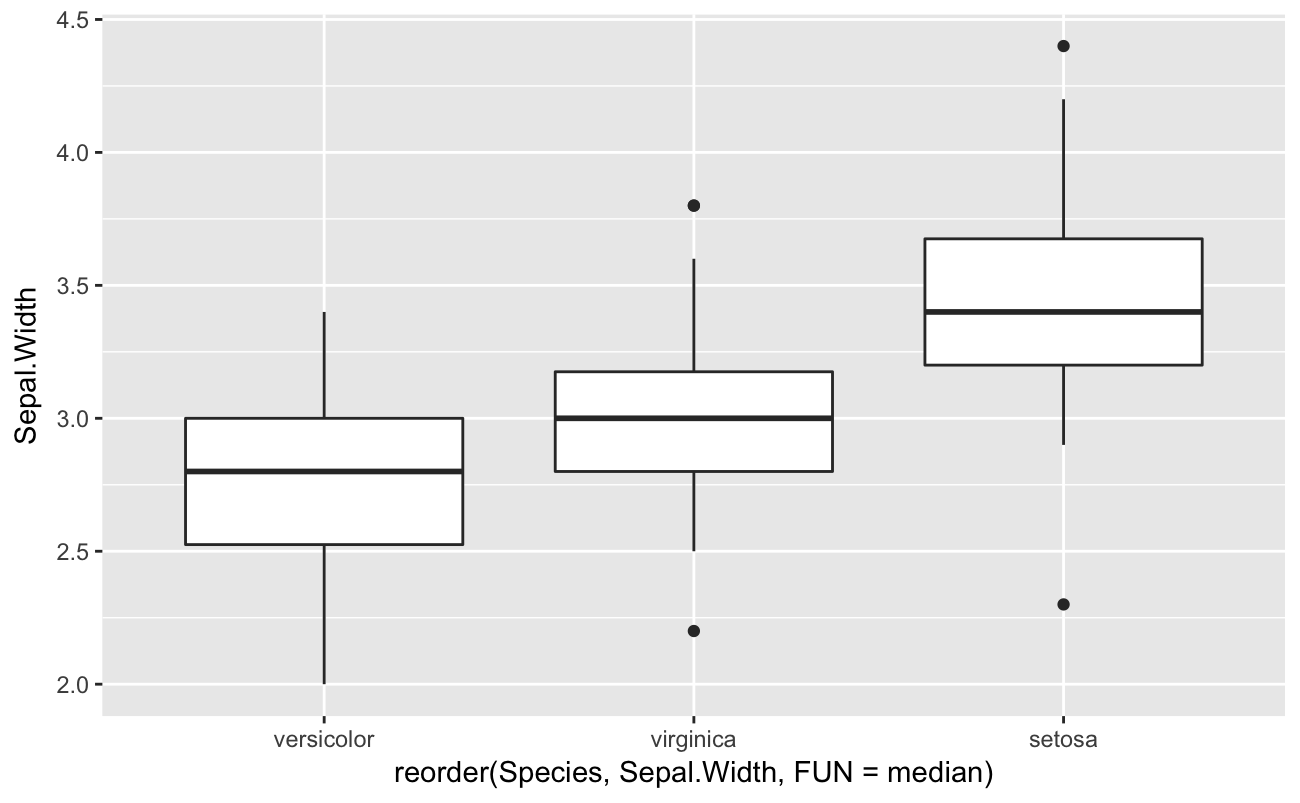
Now, reorder it according to the median levels.
ggplot(iris, aes(x = reorder(Species, Sepal.Width, FUN = median), y = Sepal.Width)) + geom_boxplot()
use the fct_reorder function from forcats. it has a similar syntax with reorder, but note that the argument fun is lower case.
library(forcats)
ggplot(iris, aes(x = fct_reorder(Species, Sepal.Width, fun = median), y = Sepal.Width)) + geom_boxplot()
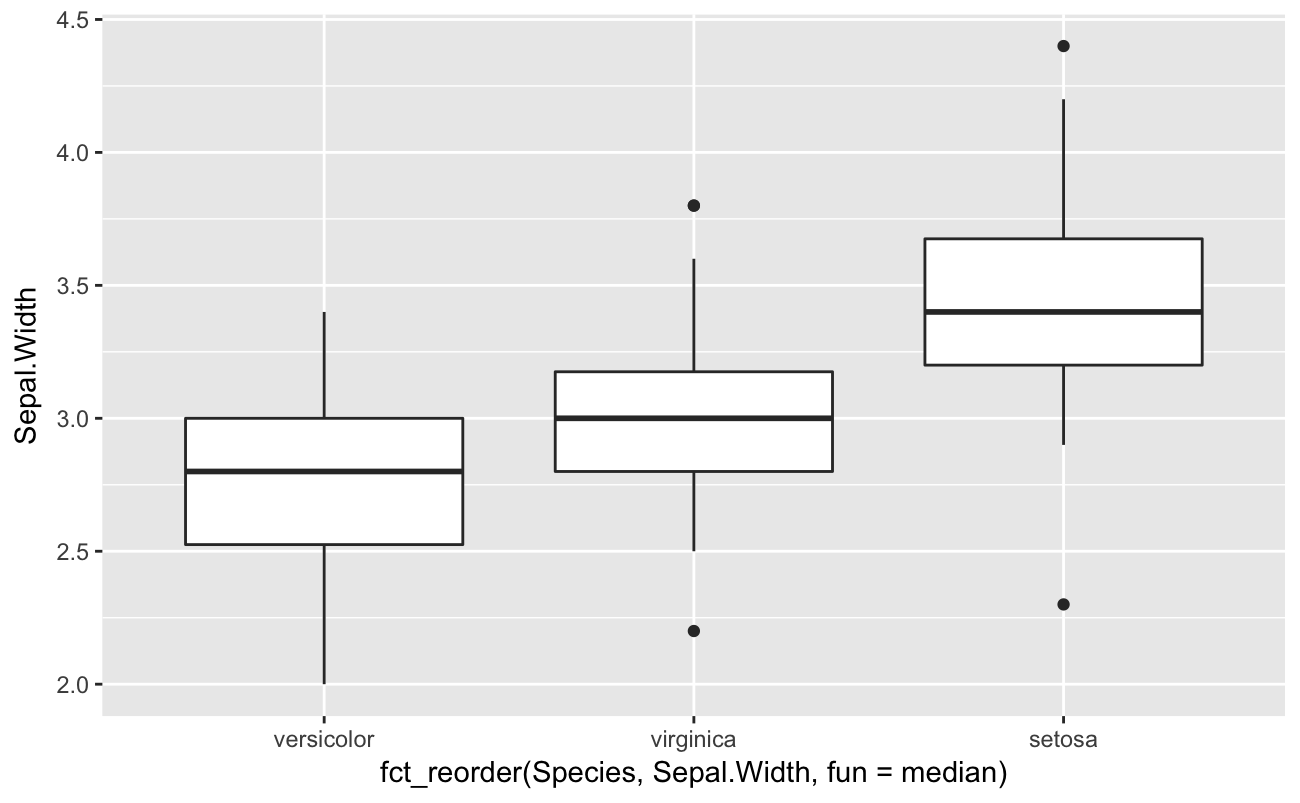
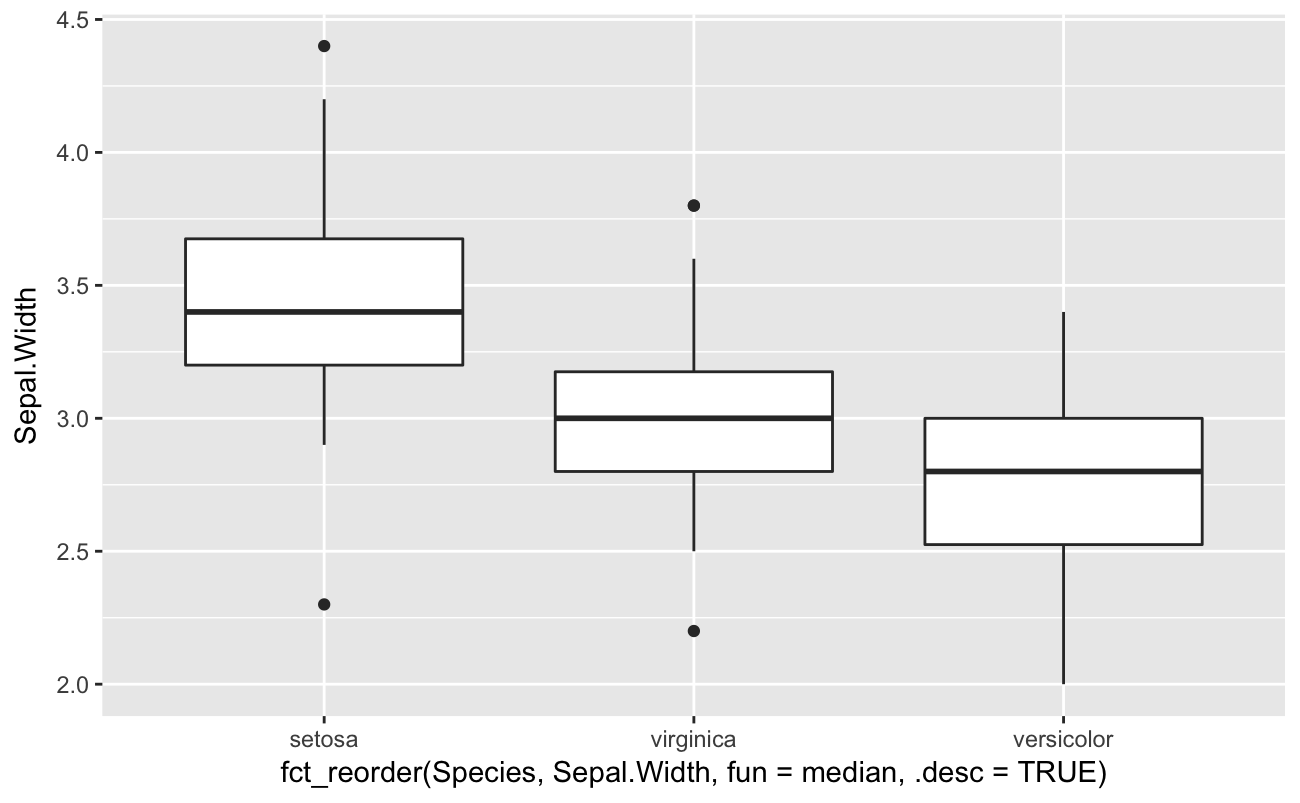
You can change the order from high to low
ggplot(iris, aes(x = fct_reorder(Species, Sepal.Width, fun = median, .desc =TRUE), y = Sepal.Width)) + geom_boxplot()
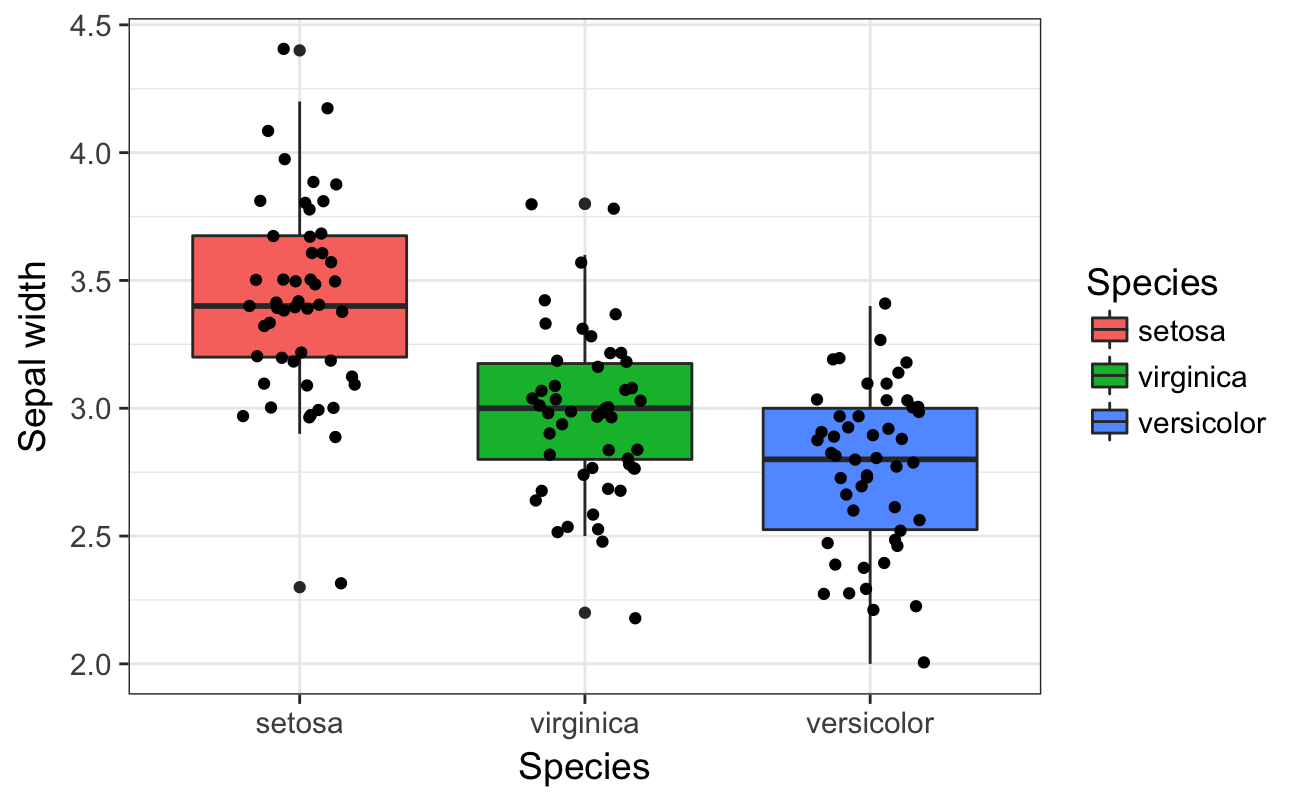
some touch-ups
ggplot(iris, aes(x = fct_reorder(Species, Sepal.Width, fun = median, .desc =TRUE), y = Sepal.Width)) +
        geom_boxplot(aes(fill = fct_reorder(Species, Sepal.Width, fun = median, .desc =TRUE))) +
        geom_jitter(position=position_jitter(0.2)) +
        theme_bw(base_size = 14) +
        xlab("Species") +
        ylab("Sepal width") +
        scale_fill_discrete(guide = guide_legend(title = "Species"))
NA
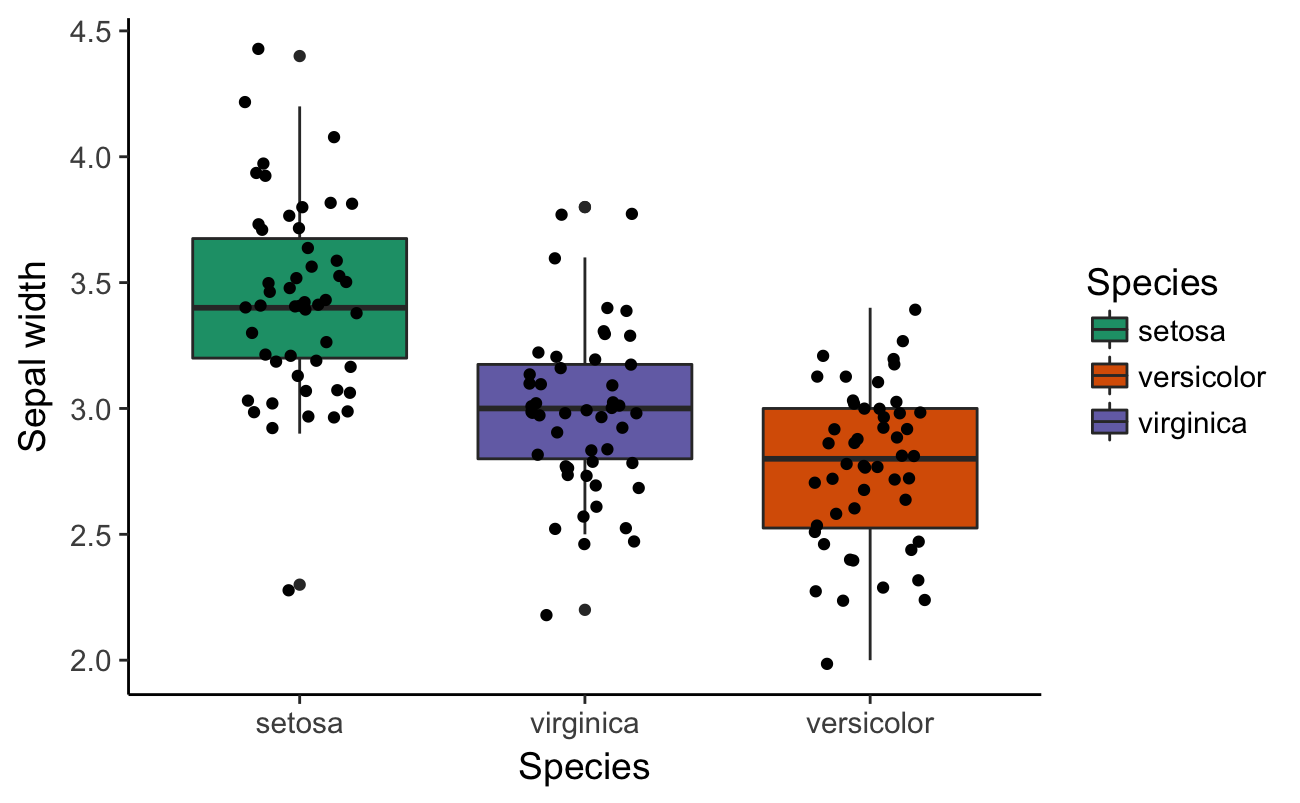
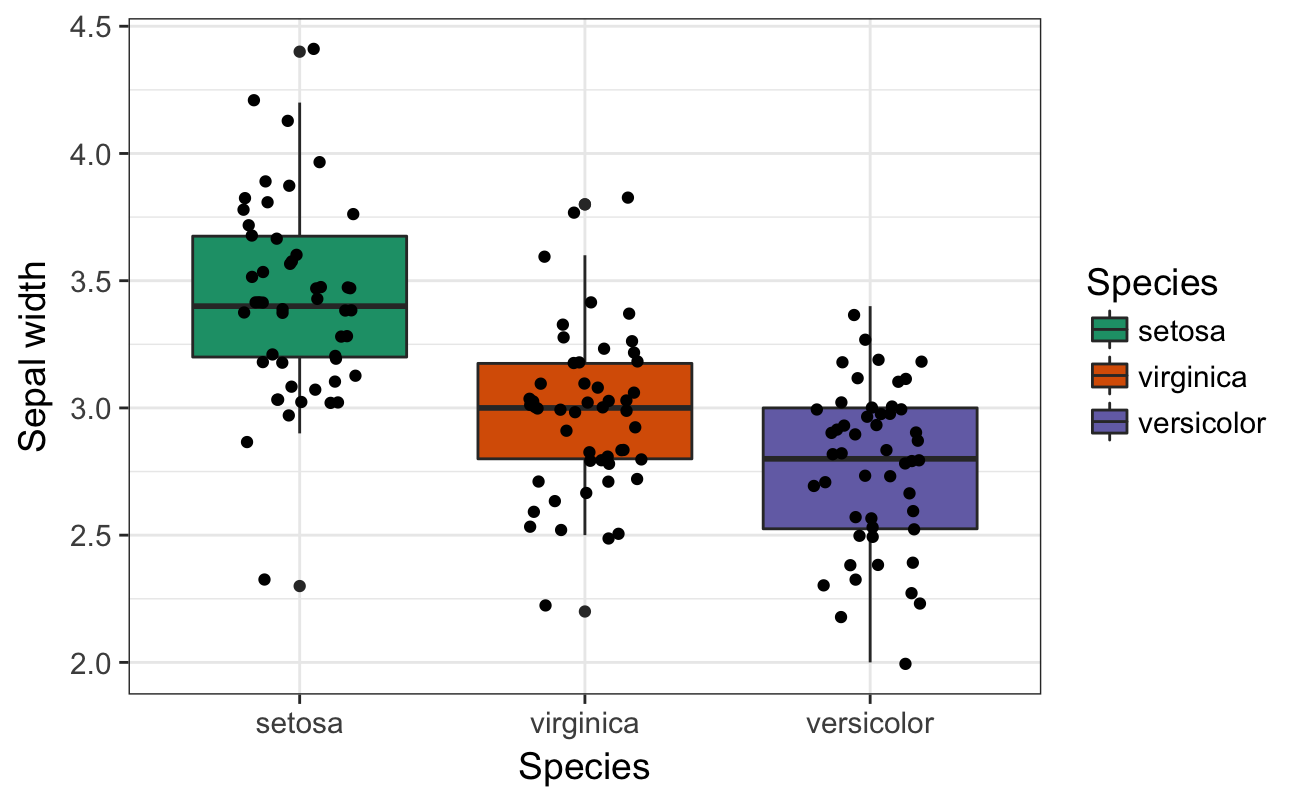
If you want to fill the colors mannually with colors from RcolorBrewer:
library(RColorBrewer)
ggplot(iris, aes(x = fct_reorder(Species, Sepal.Width, fun = median, .desc =TRUE), y = Sepal.Width)) +
        geom_boxplot(aes(fill = fct_reorder(Species, Sepal.Width, fun = median, .desc =TRUE))) +
        scale_fill_manual(values = brewer.pal(3, "Dark2"), guide = guide_legend(title = "Species")) +
        geom_jitter(position=position_jitter(0.2)) +
        theme_bw(base_size = 14) +
        xlab("Species") +
        ylab("Sepal width")
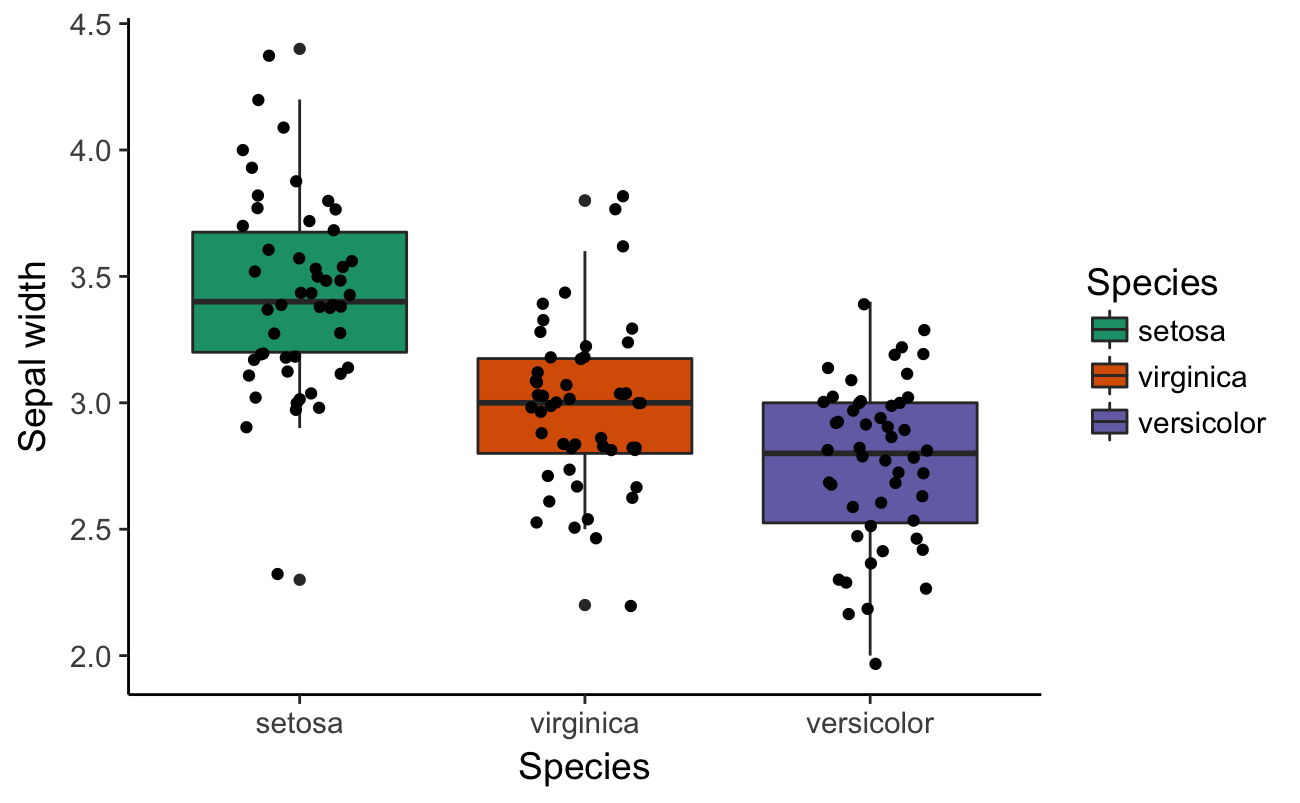
A different theme:
ggplot(iris, aes(x = fct_reorder(Species, Sepal.Width, fun = median, .desc =TRUE), y = Sepal.Width)) +
        geom_boxplot(aes(fill = fct_reorder(Species, Sepal.Width, fun = median, .desc =TRUE))) +
        scale_fill_manual(values = brewer.pal(3, "Dark2"), guide = guide_legend(title = "Species")) +
        geom_jitter(position=position_jitter(0.2)) +
        theme_classic(base_size = 14) +
        xlab("Species") +
        ylab("Sepal width")