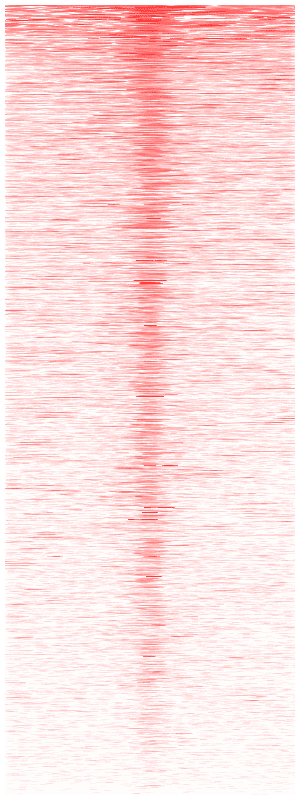
update on 04/20/2016.
I noticed that this post is the most frequently visited one. it has been almost 3 years
since I wrote this post. Now, there are various tools for this purpose. See a
post on biostars.
well, I recently just went through the whole process for making a heatmap based on a ChIP-seq data set. If you do not know the technique, google it :) http://en.wikipedia.org/wiki/ChIP-sequencing
Often, you have a ChIP-seq data that are mapped to the reference genome ( a bam file). You want to plot the sequence tag intensity around certain features ( transcription start sites, gene body, enhancers, or any other genomic region you defined).
you can make an average plot How to make TSS plot using RNA-seq and ChIP-seq data. I will need to re-write this one though, the code format is just too bad (I have to learn how to embed R and python code into the blog) ....and the Y axis is not normalized to counts per million.
you may also want to generate a heatmap with the same data. see ngsplot for examples https://code.google.com/p/ngsplot/. If you do not want to code R by yourself, try it. It has been improved a lot since last time I checked it. I once asked a question in the google group : https://groups.google.com/forum/#!topic/ngsplot-discuss/efHQ-P-14XM.
Seqmonk http://www.bioinformatics.babraham.ac.uk/projects/seqmonk/ from Simon Andrews can also plot this kind of figure very easily, I am just not satisfied with the picture quality, and I want more customized control of the picture.
I will just paste my code below, and it is heavily commented, you should be able to follow it fairly easily.
update on 05/05/2015, I put the code in a gist instead:
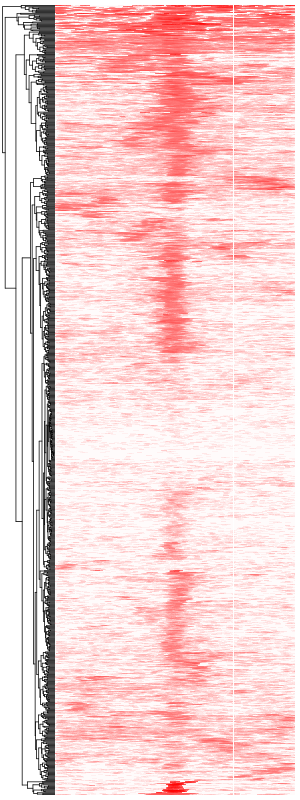
The second gist:
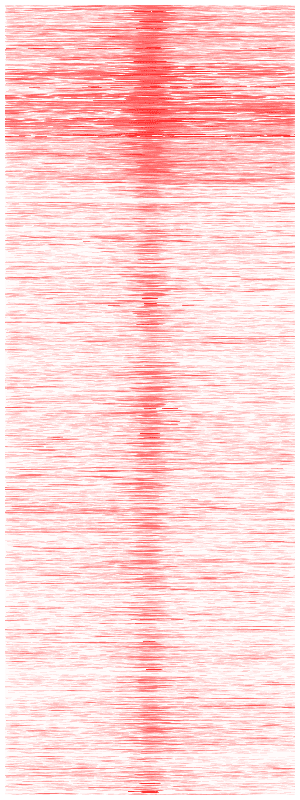
That's all!
I hope you have learned something after reading it:)
===============================
update on 09/17/13
arrange the rows in the heatmap by the coverage from strong to weak